


Noise Element
Yreka General Plan, Chapter 5
Adopted August 19, 1998Prepared by:
Bollard Acoustical Consulting
7909 Walerga Road, Suite 112-143
Antelope, CA 95843
5.1. Introduction
Section titled “5.1. Introduction”CITY LOCATION
Section titled “CITY LOCATION”The City of Yreka is located in north-central California, approximately 17 miles south of the Oregon border. The City Limits are bisected by Interstate 5, which runs generally north and south through town and is the dominant noise source in the community.
OVERVIEW
Section titled “OVERVIEW”In addition to Interstate 5, the ambient noise environment in Yreka is defined by local traffic on City streets, commercial and industrial uses, active recreation areas of parks and outdoor play areas of schools, auto racing events at the fairgrounds, and occasional railroad operations on the Yreka Western Railroad. There are no airports in the immediate vicinity of the City of Yreka, although occasional commercial, military, and general aviation aircraft overflights of the City occur. Because existing traffic volumes on City streets are relatively low, the ambient noise environment in the residential areas of the City of Yreka, which are somewhat distant from Interstate 5, is also low.
PURPOSE OF THE NOISE ELEMENT
Section titled “PURPOSE OF THE NOISE ELEMENT”The Noise Element of the City of Yreka General Plan provides a basis for comprehensive local policies to control and abate environmental noise and to protect the citizens of Yreka from excessive noise exposure. The fundamental goals of the Noise Element are as follows:
- To provide sufficient information concerning the community noise environment so that noise may be effectively considered in the land use planning process.
- To develop strategies for abating excessive noise exposure through cost-effective mitigation measures in combination with appropriate zoning to avoid incompatible land uses.
- To protect those existing regions of the planning area whose noise environments are deemed acceptable and also those locations throughout the community deemed “noise sensitive”.
- To protect existing noise-producing commercial and industrial uses in the City of Yreka from encroachment by noise-sensitive land uses.
LEGAL BASIS & REQUIREMENTS
Section titled “LEGAL BASIS & REQUIREMENTS”The noise element requirements contained in California Government Code Section 65302(f) are summarized as follows:
- A noise element shall identify and appraise noise problems in the community. The noise element shall recognize the guidelines established by the Office of Noise Control in the State Department of Health Services and shall analyze and quantify, to the extent practicable, as determined by the legislative body, current and projected noise levels for all of the following sources:
- Highways and freeways.
- Primary arterials and major local streets.
- Passenger and freight railroad operations and ground rapid transit systems.
- Commercial, general aviation, heliport, helistop, and military airport operations, aircraft overflights, jet engine test stands, and all other ground facilities and maintenance functions related to airport operation.
- Local industrial plants, including, but not limited to, railroad classification yards.
- Other ground stationary sources identified by local agencies as contributing to the community noise environment.
Noise contours shall be shown for all of these sources and stated in terms of the day/night average level (Ldn) or other appropriate noise descriptors. The noise contours shall be prepared on the basis of noise monitoring or following generally accepted noise modeling techniques for the various sources identified above.
The noise contours shall be used as a guide for establishing a pattern of land uses in the land use element that minimizes the exposure of community residents to excessive noise. The noise element shall include policies, implementation measures and possible solutions that address existing and foreseeable noise problems, if any.
5.2. Acoustical Terminology
Section titled “5.2. Acoustical Terminology”Acoustics — The science of sound.
Ambient Noise — The distinctive acoustical characteristics of a given area consisting of all noise sources audible at that location. In many cases, the term ambient is used to describe an existing or pre-project condition such as the setting in an environmental noise study.
Attenuation — The reduction of noise.
A-Weighting — A frequency-response adjustment of a sound level meter that conditions the output signal to approximate human response.
Decibel or dB — Fundamental unit of sound, defined as ten times the logarithm of the ratio of the sound pressure squared over the reference pressure squared.
CNEL — Community Noise Equivalent Level. Defined as the 24-hour average noise level with noise occurring during evening hours (7 - 10 p.m.) weighted by a factor of three and nighttime hours weighted by a factor of 10 prior to averaging.
Frequency — The measure of the rapidity of alterations of a periodic acoustic signal, expressed in cycles per second or Hertz.
Ldn — Day/Night Average Sound Level. Similar to CNEL but with no evening weighting.
Leq — Equivalent or energy-averaged sound level.
Lmax — The highest root-mean-square (RMS) sound level measured over a given period of time.
Loudness — A subjective term for the sensation of the magnitude of sound.
Noise — Unwanted sound.
5.3. Fundamentals of Noise
Section titled “5.3. Fundamentals of Noise”Noise is often described as unwanted sound. Sound is defined as any pressure variation in air that the human ear can detect. If the pressure variations occur frequently enough (at least 20 times per second), they can be heard and hence are called sound. The number of pressure variations per second is called the frequency of sound, and is expressed as cycles per second, called Hertz (Hz). Measuring sound directly in terms of pressure would require a very large and awkward range of numbers. To avoid this, the decibel scale was devised. The decibel scale uses the hearing threshold (20 micropascals), as a point of reference, defined as 0 dB. Other sound pressures are then compared to the reference pressure, and the logarithm is taken to keep the numbers in a practical range. The decibel scale allows a million-fold increase in pressure to be expressed as 120 dB. Another useful aspect of the decibel scale is that changes in levels (dB) correspond closely to human perception of relative loudness. Figure I shows examples of noise levels for several common noise sources and environments.
The perceived loudness of sounds is dependent upon many factors, including sound pressure level and frequency content. However, within the usual range of environmental noise levels, perception of loudness is relatively predictable, and can be approximated by weighing the frequency response of a sound level meter by means of the standardized A-weighing network. There is a strong correlation between A-weighted sound levels (expressed as dBA) and community response to noise. For this reason, the A-weighted sound level has become the standard tool of environmental noise assessment. All noise levels reported in this document are in terms of A-weighted levels.
Community noise is commonly described in terms of the “ambient” noise level, which is defined as the all-encompassing noise level associated with a given noise environment. A common statistical tool to measure the ambient noise level is the average, or equivalent, sound level (Leq), which corresponds to a steady-state A-weighted sound level containing the same total energy as a time-varying signal over a given time period (usually one hour). The Leq is the foundation of the composite noise descriptor, Ldn, and shows very good correlation with community response to noise.
The Day-Night Average Level (Ldn) is based upon the average noise level over a 24-hour day, with a +10 decibel weighing applied to noise occurring during nighttime (10:00 p.m. to 7:00 a.m.) hours. The nighttime penalty is based upon the assumption that people react to nighttime noise exposures as though they were twice as loud as daytime exposures. Because Ldn represents a 24-hour average, it tends to disguise short-term variations in the noise environment.
Noise in the community has often been cited as being a health problem, not in terms of actual physiological damages such as hearing impairment, but in terms of inhibiting general well-being and contributing to undue stress an annoyance. The health effects of noise in the community arise from interference with human activities such as sleep, speech, recreation and tasks demanding concentration or coordination. When community noise interferes with human activities or contributes to stress, public annoyance wit the noise source increases, the acceptability of the environment for people decreases. This decrease in acceptability and the threat to public well-being are the bases for land use planning policies preventing exposures to excessive community noise levels.
To control noise from fixed sources which have developed from processes other than zoning or land use planning, many jurisdictions have adopted community noise control ordinances. Such ordinances are intended to abate noise nuisances and to control noise from existing sources. They may also be used as performance standards to judge the creation of a potential nuisance, or potential encroachment of sensitive uses upon noise-producing facilities. Community noise control ordinances are generally designed to resolve noise problems on a short-term basis (usually by means of hourly noise level criteria), rather than on the basis of 24-hour or annual cumulative noise exposures.
In addition to the A-weighted noise level, other factors should be considered in establishing criteria for noise sensitive land uses. For example, sounds with noticeable tonal content such as whistles, horns, droning or high-pitched sounds may be more annoying than the A-weighted sound level alone suggests. Many noise standards apply a penalty, or correction, of 5 dBA to such sounds. The effects of unusual tonal content are generally more of a concern at nighttime, when residents may notice the sound in contrast to low levels of background noise.
Because many rural residential areas experience very low noise levels, residents may express concern about the loss of “peace and quiet” due to the introduction of a sound which was not audible previously. In very quiet environments, the introduction of virtually any change in local activities will cause an increase in noise levels. A change in noise level and the loss of “peace and quiet” is the inevitable result of land use or activity changes in such areas. Audibility of a new noise source and/or increases in noise levels within recognized acceptable limits are not usually considered to be significant noise impacts, but these concerns should be addressed and considered in the planning and environmental review processes.
5.4. Existing and Future Noise Environments
Section titled “5.4. Existing and Future Noise Environments”OVERVIEW
Section titled “OVERVIEW”The City of Yreka City limits and General Plan Noise Element study area are shown by Figure 2. The major noise sources in Yreka consist of Interstate 5 and local traffic on City streets, commercial and industrial uses, active recreation areas of parks, outdoor play areas of schools, auto racing events at the fairgrounds, and occasional railroad operations on the Yreka Western Railroad. Each of these noise sources is discussed individually below.
ROADWAYS
Section titled “ROADWAYS”The Federal Highway Administration Highway Traffic Noise Prediction Model (FHWA-RD-77-108) with the Calveno vehicle noise emission curves was used to predict traffic noise levels within the Yreka City Limits. The FHWA Model is the traffic noise prediction model currently preferred by the Federal Highway Administration, the State of California Department of Transportation (Caltrans), and most city and county governments, for use in traffic noise assessment. Although the FHWA Model is in the process of being updated by a more sophisticated traffic noise prediction model, the use of RD-77-108 is considered acceptable for the development of General Plan traffic noise predictions.
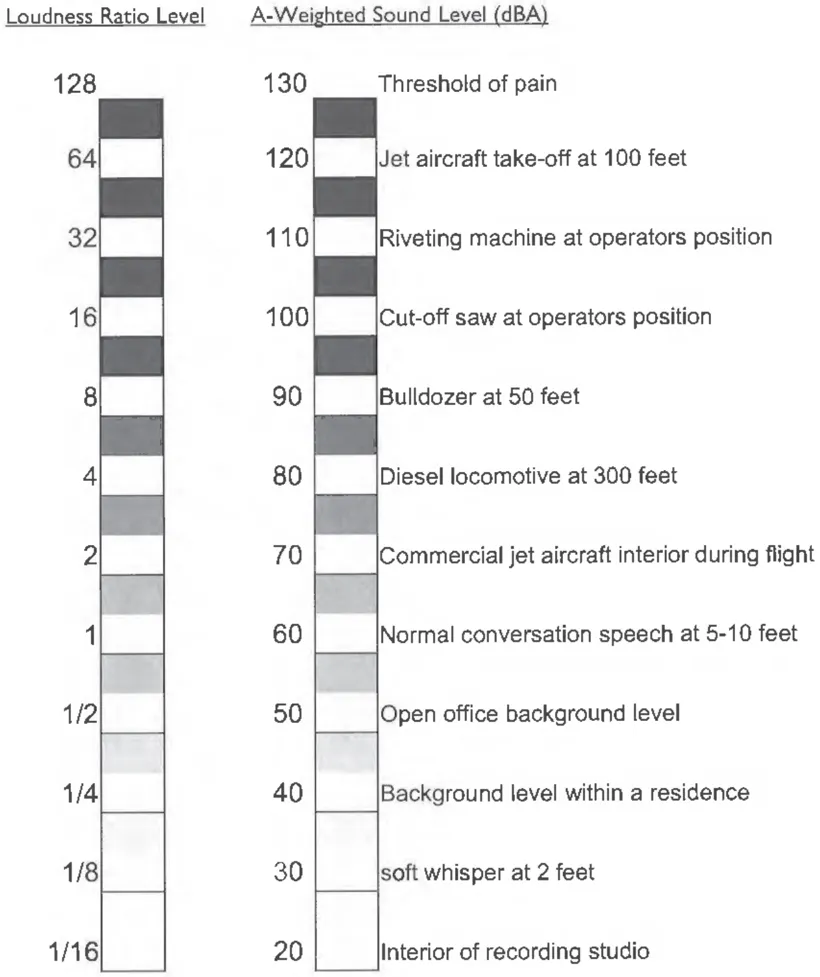
Figure I – Typical A-Weighted Sound Levels of Common Noise Sources
Interstate 5, Highway 3 (Fort Jones Road, Main Street & Montague Road), and Highway 263
Section titled “Interstate 5, Highway 3 (Fort Jones Road, Main Street & Montague Road), and Highway 263”Interstate 5 and Highway 3 are the two most heavily traveled roadways in the City of Yreka. The FHWA Model was used with traffic data obtained from published Caltrans traffic counts and BAC field surveys to develop Ldn contours for Interstate 5, Highway 3, and Highway 263 within the City of Yreka. The FHWA Model input data for those roadways is provided inTable 1. The distances from the centerlines of the major roadways to the 60 and 65 dB Ldn contours are also summarized in Table I, and the 60 dB Ldn contour locations for existing conditions on Interstate 5 are shown on Figure 3. Figure 4 shows the results of continuous noise level measurements conducted adjacent to Interstate 5.
Topography in the City of Yreka varies, sometimes alternating from flat to moderately hilly along relatively short roadway segments. Due to the topographic complexity of the City of Yreka, it was not possible to evaluate the effects of topography on traffic noise within the framework of the General Plan Noise Element. Therefore, the contour distances presented in Table 1 and the Interstate 5 noise exposure contours shown on Figure 3 should be considered conservative estimates of traffic noise exposure, to be supplemented by a detailed and project-specific study as needed.
Oberlin Road, Oregon Street, Phillipe Lane, Fairlane Road, Foothill Drive
Section titled “Oberlin Road, Oregon Street, Phillipe Lane, Fairlane Road, Foothill Drive”The data contained in Table I, and the noise contours shown on Figure 3, are limited to existing Interstate 5, and Highway 3, and Highway 263, as this is the only comprehensive data available which describes existing traffic conditions in the City of Yreka. However, the roadways listed above are fairly major traffic arterials within the City of Yreka. As the circulation Element of the Yreka General Plan is updated, additional analysis of existing and projected future traffic noise levels within the City can and should be performed for these roadways. In the absence of existing and projected future traffic data for the major roadways in the City of Yreka, the distance to the 60 dB Ldn traffic noise contours for these roadways can be estimated using Figure 5.
RAILROADS
Section titled “RAILROADS”Railroad activity in the City of Yreka consists of occasional freight and passenger operations on the Yreka Western Railroad (YWRR) tracks. The YWRR tracks generally follow Foothill Drive from the fairgrounds to the eastern City limits, as shown on Figure 2.
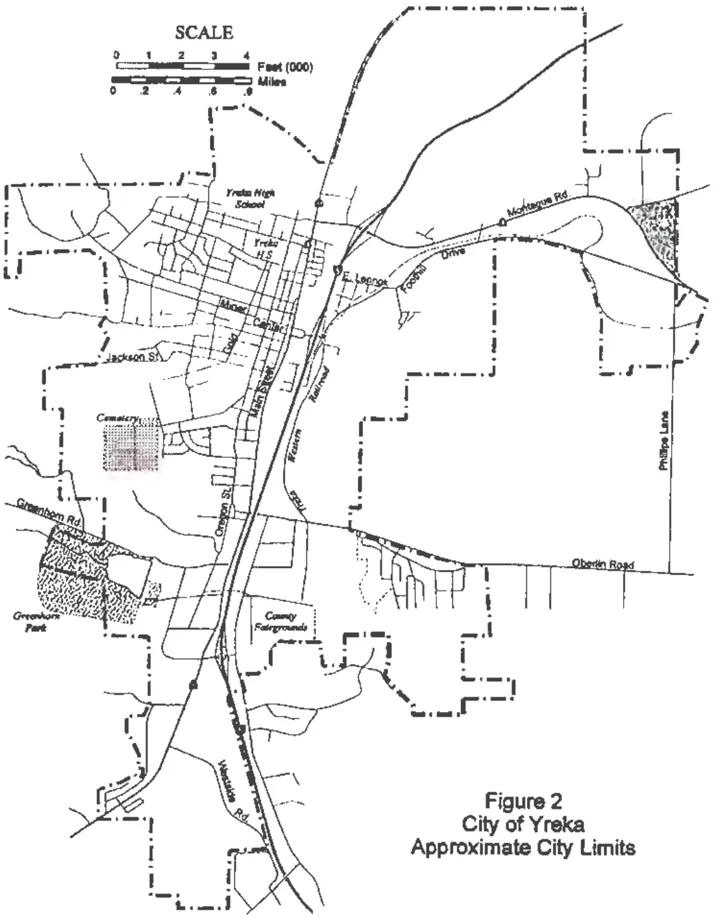
Figure 2 – City of Yreka Approximate City Limits
According to a representative of the YWRR, freight train activity on this line generally consists of one freight train per day, five days per week. These operations generally occur between the railroad depot and the lumber mills on the east side of the City. Passenger train activity on this line consists of one excursion train per day, Wednesday through Sunday, during summer months, and on weekends only during the month of September. In addition, there are reportedly 12 charter passenger trains per year. Passenger service on this line typically extends from the Yreka depot to the City of Montague to the east.
Due to the low number of existing daily railroad operations on the YWRR, railroad noise generation in Yreka is not expected to exceed accepted land-use compatibility criteria at noise-sensitive land uses in the City. It is recognized, however, that the use of the railroad warning horns at the roadway crossings results in brief periods of elevated noise levels in the proximity of the tracks.
It is difficult to predict future railroad noise exposure in the City of Yreka without knowing if, or to what degree, railroad activity may change in the future. Table 2 was developed to estimate the distances to the 60 and 65 dB Ldn railroad noise contours for various numbers of future daily trains in Yreka. The Table 2 data assume that, since this is a spur line, additional railroad operations in Yreka would primarily occur during daytime hours (7 am to 10 pm). The Table 2 data also assume a mean railroad sound exposure level (SEL) of 100 dB at a distance of 100 feet.
NON-TRANSPORTATION NOISE SOURCES
Section titled “NON-TRANSPORTATION NOISE SOURCES”The production of noise is a result of many processes and activities, even when the best available noise control technology is applied. Noise exposures within industrial facilities are controlled by Federal and State employee health and safety regulations (OSHA), but exterior noise levels may exceed locally acceptable standards. Commercial, recreational and public service facility activities can also produce noise which affects adjacent sensitive land uses.
From a land use planning perspective, fixed-source noise control issues focus upon two goals: to prevent the introduction of new noise-producing uses in noise-sensitive areas, and to prevent encroachment of noise-sensitive uses upon existing noise-producing facilities. The first goal can be achieved by applying noise performance standards to proposed new noise-producing uses. The second goal can be met by requiring that new noise-sensitive uses in proximity to noise-producing facilities include mitigation measures to ensure compliance with those noise performance standards.
Descriptions of existing fixed noise sources in the City of Yreka are provided below. These uses are intended to be representative of the relative noise generation of such uses, and are intended to identify specific noise sources which should be considered in the review of development proposals. Site specific noise analyses should be performed where noise sensitive land uses are proposed in proximity to these (or similar) noise sources, or where similar sources are proposed to be located near noise-sensitive land uses.
Table 5-1 – FHWA-RD-77-108 Highway Traffic Noise Prediction Model Data Inputs and Distances to 60 and 65 dB Ldn Contours City of Yreka Noise Element - Existing (1996) Conditions
| Segment | Roadway Name | Segment Description | ADT | Day % | Night % | Truck Usage - Med. | Truck Usage - Hvy. | Speed | Distance to Ldn Contours, feet - 60 dB Ldn | Distance to Ldn Contours, feet - 65 dB Ldn |
|---|---|---|---|---|---|---|---|---|---|---|
| 1 | Interstate 5 | Southern City Limits to Fairgrounds Exit | 15,100 | 77 | 23 | 5 | 24 | 65 | 870 | 404 |
| 2 | Interstate 5 | Fairgrounds Exit to Miner Street | 14,800 | 77 | 23 | 5 | 26 | 65 | 888 | 412 |
| 3 | Interstate 5 | Miner Street to Highway 3 | 13,700 | 77 | 23 | 5 | 29 | 65 | 885 | 411 |
| 4 | Interstate 5 | North of Highway 3 | 13,000 | 77 | 23 | 5 | 31 | 65 | 881 | 409 |
| 5 | Highway 3 | South City Limits to Southern I-5 Access | 13,000 | 83 | 17 | 1 | 2 | 50 | 238 | 110 |
| 6 | Highway 3 | Southern I-5 Access to Oberlin Road | 10,000 | 83 | 17 | 1 | 2 | 45 | 169 | 79 |
| 7 | Highway 3 | Oberlin Road to Center Street | 10,900 | 83 | 17 | 1 | 2 | 35 | 124 | 58 |
| 8 | Highway 3 | Center Street to Junction 263 | 7,200 | 83 | 17 | 1 | 2 | 35 | 94 | 44 |
| 9 | Highway 3 | Junction 263 to I-5 | 4,300 | 83 | 17 | 1 | 2 | 35 | 67 | 31 |
| 10 | Highway 3 | I-5 to Ager Road | 2,900 | 83 | 17 | 2 | 2 | 45 | 76 | 35 |
| 11 | Highway 3 | Ager Road to Phillipe Road | 2,800 | 83 | 17 | 2 | 2 | 55 | 102 | 47 |
| 12 | Highway 263 | Highway 3 to Northern City Limits | 2,000 | 83 | 17 | 2 | 3 | 55 | 86 | 40 |
Source: Annual Average Daily Truck Traffic on the California State Highway System, Caltrans, October 1996
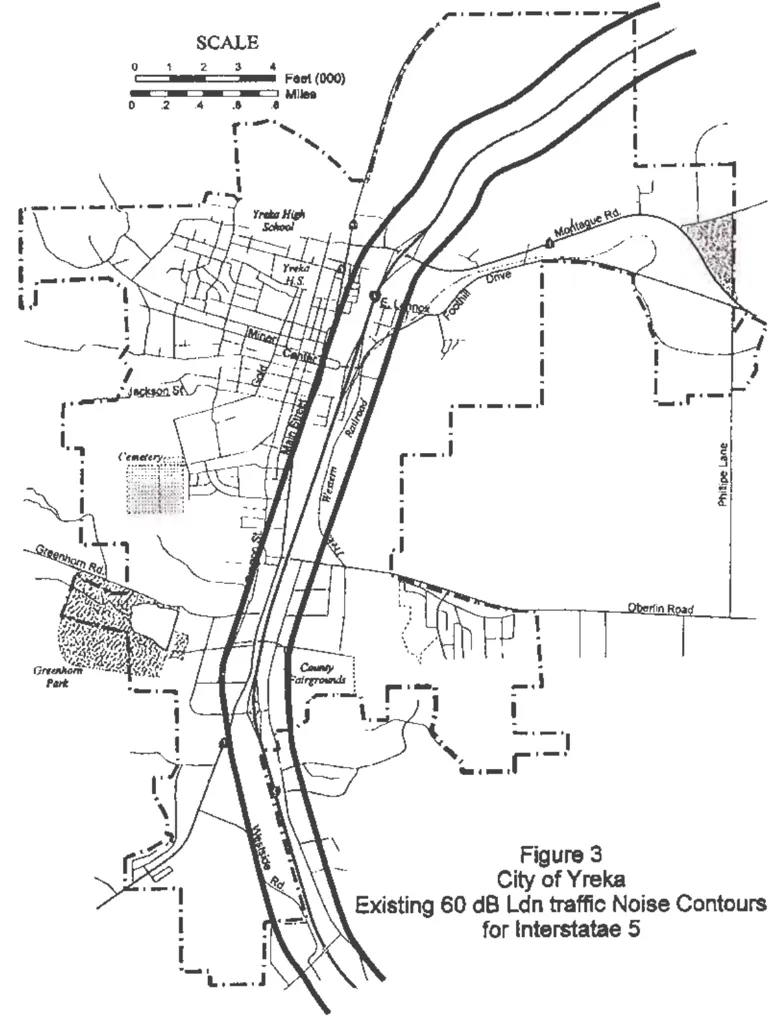
Figure 3 – City of Yreka Existing 60 dB Ldn traffic Noise Contours for Interstatae 5
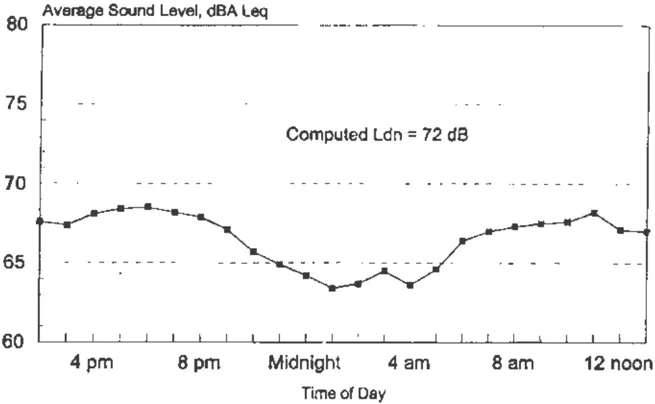
Figure 4 – Measured Interstate 5 Traffic Noise Levels (150 feet from centerline) 416 E. Lennox Street – May 6-7, 1998
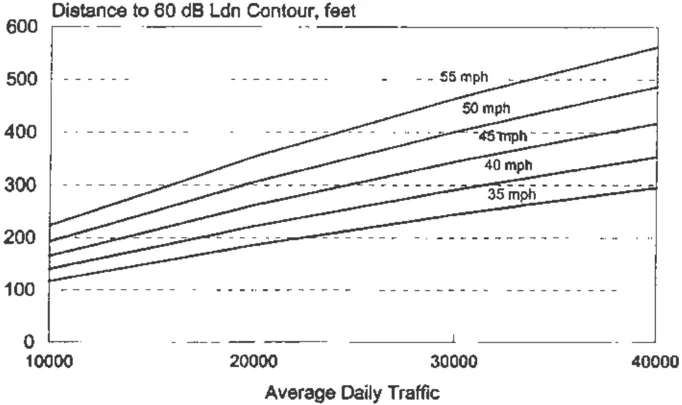
Figure 5 – Methodology from Predicting Distance Traffic Noise Contours for Arterial Traffic City of Yreka Noise Element
Table 5-2 – Railroad Noise Exposure as a Function of the Number of Daily Trains Yreka Noise Element
| Number of Daily Trains | Ldn at 100 feet, dB - Without Horn | Ldn at 100 feet, dB - With Horn | Distance to 60 dB Ldn Noise Contours - Without Horn | Distance to 60 dB Ldn Noise Contours - With Horn |
|---|---|---|---|---|
| 1 | 51 | 56 | 24 | 51 |
| 2 | 54 | 59 | 38 | 81 |
| 3 | 55 | 60 | 49 | 106 |
| 5 | 58 | 63 | 69 | 150 |
| 7 | 59 | 64 | 87 | 187 |
| 10 | 61 | 66 | 110 | 237 |
Note: The predicted distances to the Ldn contours assume a mean railroad sound exposure level of 100 dB without horn usage and 105 dB with horn usage at a reference distance of 100 feet from the tracks and that all train operations occur during daytime hours.
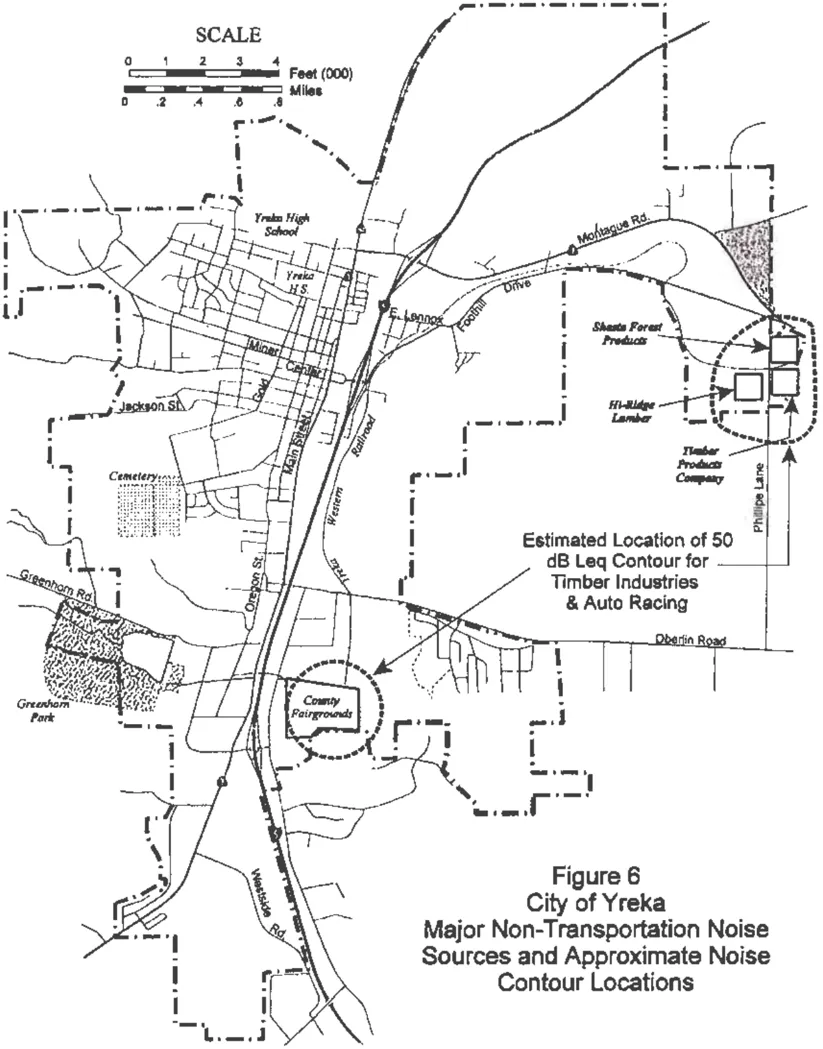
Figure 6 – City of Yreka Major Non-Transportation Noise Sources and Approximate Noise Contour Locations
Shasta Forrest Products - 1423 Montague Road
Section titled “Shasta Forrest Products - 1423 Montague Road”Operations at the Shasta Forrest Products facility consist of processing bark into landscape products.
According to Mr. Steve Bradley of Shasta Forest Products, operations at this facility are seasonal, and normally occur between 7 am and 5:30 pm, five days per week, but the facility is not precluded from operating 24-hours per day. The most significant noise-producing equipment at this facility includes the main mill, which grinds and screens bark, a raw bark screen, and a re-grinder and screen. The plant generates approximately 13 truck trips on a typical day. Much of the raw bark material is provided by the Timber Products facility, which is located immediately south of the Shasta Forest Products site, but some material is trucked into the facility from other sources.
Noise level measurements conducted in the vicinity of this facility indicate that plant-generated noise levels vary, but are highest in the immediate vicinity of the milling equipment. The estimated location of the plant 50 dB average (Leq) noise contour is shown on Figure 6. Mr. Bradley was unaware of any noise complaints associated with the operation of this facility, and there are currently no specific plans for expansion of this facility.
Timber Products - 130 N. Phillipe Lane
Section titled “Timber Products - 130 N. Phillipe Lane”Operations at the Timber Products facility consist of the manufacture of soft wood veneer and pulp chips. According to Mr. Pete Himmel of Timber Products, operations at this facility typically occur from 5 am to 6 pm, 7 days per week, but the plant is not precluded from 24-hour operations. The most significant noise-producing equipment at this facility consists of the outdoor chipper and log-moving equipment, as most of the plant equipment is housed indoors. The plant generates approximately 80 truck trips on a typical day.
Noise level measurements conducted in the vicinity of this facility indicate that plant-generated noise levels vary, but are highest in the immediate vicinity of the chipping equipment. The estimated location of the plant 50 dB average (Leq) noise contour is shown on Figure 6. Mr. Himmel was unaware of any noise complaints associated with the operation of this facility, and the plant is currently being expanded. The effects of the plant expansion on the ambient noise environment in the immediate plant vicinity are unknown.
Hi-Ridge Lumber Company - 329 N. Phillipe Lane
Section titled “Hi-Ridge Lumber Company - 329 N. Phillipe Lane”Operations at the Hi-Ridge facility consist of the production of various lumber products. According to Mr. Gerry Bendix of Hi-Ridge, operations at this facility typically occur from 6 am to 3 pm, 5 days per week. The most significant noise-producing equipment at this facility consists of saws, planers, motors, forklifts, cranes and log loaders. The plant generates approximately 50 truck trips on a typical day. This facility also ships lumber products by rail.
The Hi-Ridge Lumber Company was not in operation at the time the Noise-Element was being prepared. As a result, no noise measurements of the facility could be conducted. Based on the types of equipment used a this facility, the location of the plant 50 dB average (Leq) noise contour was estimated and is shown on Figure 6. Mr. Bendix was unaware of any noise complaints associated with the operation of this facility, and the plant currently has no plans for expansion.
Auto Racing - Siskiyou County Fairgrounds
Section titled “Auto Racing - Siskiyou County Fairgrounds”According to Ms. Jackie Zediker of the Fairgrounds, auto racing at that location typically occurs every Saturday night from mid-April to through mid-September. The races take place on a 1/4 mile track between the hours of 6:30 pm and 11:00 pm. The distance to the 50 dB Leq noise contour for race events was estimated from BAC file data, and is shown on Figure 6.
General Service Commercial & Light Industrial Uses
Section titled “General Service Commercial & Light Industrial Uses”Noise sources associated with service commercial uses such as automotive and truck repair facilities, wrecking yards, tire installation centers, car washes, loading docks, transfer stations, corporation yards, recycling centers, concrete ready-mix facilities, are found at various locations within the City of Yreka. Many of these sources are located on Main Street, Oregon Road, Oberlin Road, Foothill Drive and Fairlane Road. The noise emissions of these types of uses are dependant on many factors, and are therefore, difficult to quantify precisely. Nonetheless, noise generated by the these uses contributes to the ambient noise environment in the immediate vicinity of these uses, and should be considered where either new noise-sensitive uses are proposed nearby or where similar uses are proposed in existing residential areas.
Parks and School Playing Fields
Section titled “Parks and School Playing Fields”There are several park and school uses within the City limits. These uses are spread throughout the City. Noise generated by these uses depends on the age and number of people utilizing the respective facility at a given time, and the types of activities they are engaged in. School playing field activities tend to generate more noise than those of neighborhood parks, as the intensity of school playground usage tends to be much higher. At a distance of 100 feet from an elementary school playground being used by 100 students, average and maximum noise levels of 60 and 75 dB, respectively, can be expected. At organized events such as high-school football games with large crowds and public address systems, the noise generation is often significantly higher. As with service commercial uses, the noise generation of parks and school playing fields is variable.
AIRPORTS
Section titled “AIRPORTS”The City of Yreka is separated from the Weed and Montague airports by considerable distances. Although occasional aircraft overflights of the City occur, the City of Yreka is located well beyond the noise impact zones of these airports. As a result, the existing ambient noise environment of the City of Yreka is not significantly influenced by aircraft noise.
COMMUNITY NOISE SURVEY
Section titled “COMMUNITY NOISE SURVEY”To quantify existing noise levels in the quieter parts of the City of Yreka, a community noise survey was performed at 8 locations in this City which are removed from major noise sources. Two of the eight locations were monitored over a continuous 24-hour period, while the other six locations were each monitored for two 15-minute periods during daytime hours and one 15-minute period during nighttime hours. The community noise survey noise measurement locations are shown on Figure 7. The results of the community noise survey are provided in Table 3, and Figures 8 and 9 show the measurement results at the continuous monitoring sites.
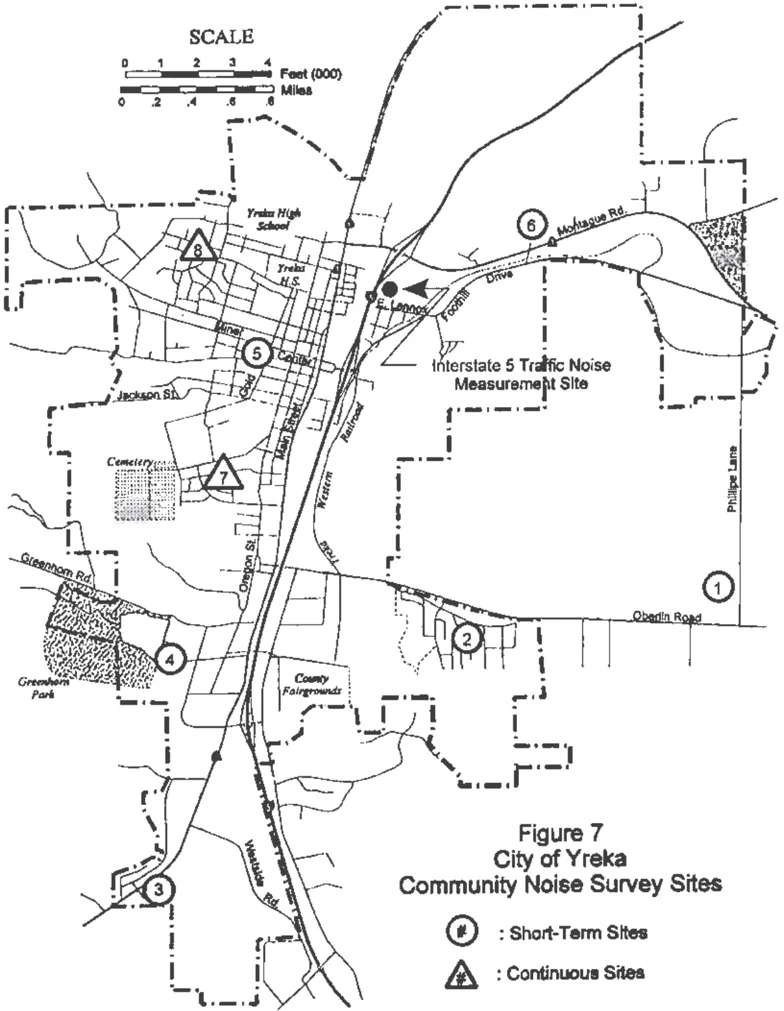
Figure 7 – City of Yreka Community Noise Survey Sites
Table 5-3 – Community Noise Measurement Survey Results Yreka Noise Element - May 6-7, 1998
Site 1: NW Corner of Phillipe & Oberlin
Sources of Noise: Trucks - Phillipe, Oberlin, local traffic
| Dates | Time Period | Leq | Lmax | Lmin | Estimated Ldn |
|---|---|---|---|---|---|
| 5-6-98 | Morning | 56 | 76 | 26 | 55 |
| 5-7-98 | Afternoon | 54 | 69 | 32 | |
| 5-7-98 | Nighttime | 46 | 68 | 21 |
Site 2: Placer Street North of Nugget
Sources of Noise: Dogs, local & distant traffic
| Dates | Time Period | Leq | Lmax | Lmin | Estimated Ldn |
|---|---|---|---|---|---|
| 5-6-98 | Morning | 46 | 61 | 30 | 48 |
| 5-7-98 | Afternoon | 51 | 67 | 40 | |
| 5-7-98 | Nighttime | 31 | 44 | 24 |
Site 3: Corner of Laura & Murray
Sources of Noise: Hwy 3 & I-5 traffic, bird, frogs
| Dates | Time Period | Leq | Lmax | Lmin | Estimated Ldn |
|---|---|---|---|---|---|
| 5-6-98 | Morning | 45 | 63 | 33 | 48 |
| 5-7-98 | Afternoon | 49 | 68 | 36 | |
| 5-7-98 | Nighttime | 39 | 43 | 35 |
Site 4: Greenhorn Park
Sources of Noise: Commercial air blast, local traffic, birds, distant traffic
| Dates | Time Period | Leq | Lmax | Lmin | Estimated Ldn |
|---|---|---|---|---|---|
| 5-6-98 | Morning | 43 | 57 | 39 | 48 |
| 5-7-98 | Afternoon | 45 | 58 | 39 | |
| 5-7-98 | Nighttime | 41 | 55 | 33 |
Site 5: City Park: Gold & Miner
Sources of Noise: Local traffic, children playing
| Dates | Time Period | Leq | Lmax | Lmin | Estimated Ldn |
|---|---|---|---|---|---|
| 5-6-98 | Morning | 55 | 68 | 42 | 53 |
| 5-7-98 | Afternoon | 52 | 69 | 39 | |
| 5-7-98 | Nighttime | 39 | 49 | 31 |
Site 6: Juniper Drive
Sources of Noise: Distant highway 3 traffic, birds
| Dates | Time Period | Leq | Lmax | Lmin | Estimated Ldn |
|---|---|---|---|---|---|
| 5-6-98 | Morning | 41 | 65 | 30 | 42 |
| 5-7-98 | Afternoon | 43 | 64 | 30 | |
| 5-7-98 | Nighttime | 32 | 41 | 27 |
Site 7: 505 Turre Street
Sources of Noise: Dogs, local traffic
| Dates | Time Period | Leq | Lmax | Lmin | Estimated Ldn |
|---|---|---|---|---|---|
| 5-5/6-98 | Daytime | 45 | 67 | 39 | 51 |
| 5-5/6-98 | Nighttime | 44 | 57 | 38 |
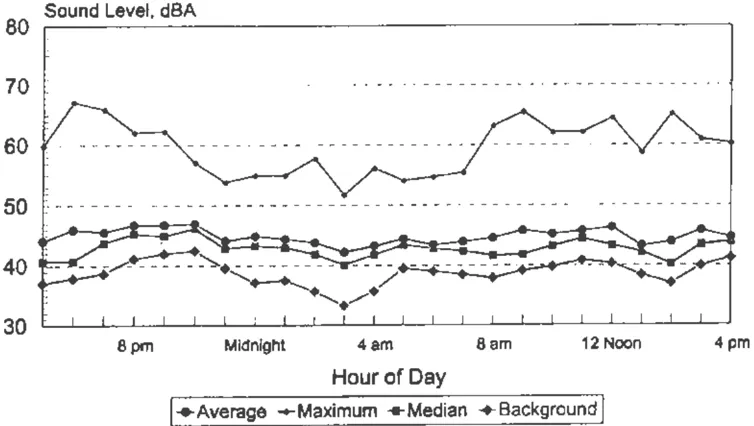
Figure 8 – Measured Ambient Noise Levels 505 Turre Street, May 5-6, 1998
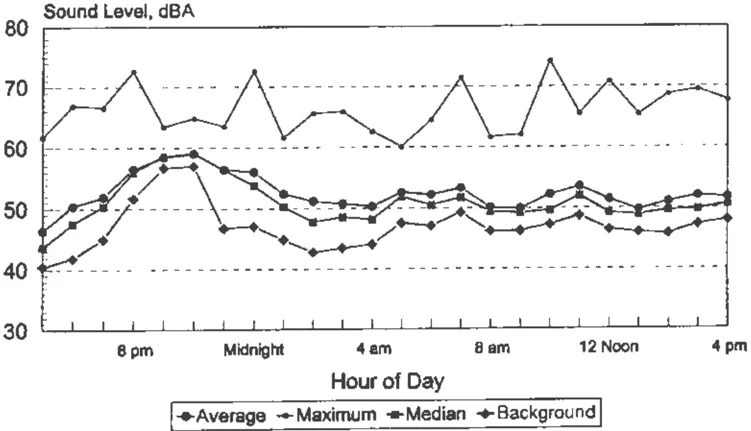
Figure 9 – Measured Ambient Noise Levels 908 Cedar Street – May 5-6, 1998
BACKGROUND ON CRITERIA FOR ACCEPTABLE NOISE EXPOSURE
Section titled “BACKGROUND ON CRITERIA FOR ACCEPTABLE NOISE EXPOSURE”The State Office of Planning and Research (OPR) Noise Element Guidelines include recommended exterior and interior noise level standards for local jurisdictions to identify and prevent the creation of incompatible land uses due to noise. The OPR guidelines contain a land use compatibility table which describes the compatibility of different land uses with a range of environmental noise levels in terms of Ldn. A noise environment of 60 dB Ldn or less is considered to be normally acceptable for residential uses according to those guidelines.
The U.S. Environmental Protection Agency (EPA) also offers guidelines for community noise exposure in the publication “Information on the Levels of Environmental Noise Requisite to Protect Public Health and Welfare with an Adequate Margin of Safety”. These guidelines consider occupational noise exposure as well as noise exposure in the home. The “Levels Document” recognizes an exterior noise level of 55 dB Ldn as a goal to protect the public from hearing loss, activity interference, sleep disturbance and annoyance. The EPA notes, however, that this level is not a regulatory goal, but is a level defined by a negotiated scientific consensus without concern for economic and technological feasibility or the needs and desires of any particular community. The EPA and other Federal agencies have suggested land use compatibility guidelines which indicate that residential noise exposures of 55 to 65 dB Ldn are acceptable.
The U.S. Environmental Protection Agency has also prepared a Model Community Noise Control Ordinance, using Leq as the means of defining allowable residential noise level limits. The EPA model contains no specific recommendations for local noise level standards, but reports a range of Leq values as adopted by various local jurisdictions. The mean daytime residential noise standard reported by the EPA is 57 dBA (Leq); the mean nighttime residential noise standard is 52 dBA (Leq). Other state laws and regulations regarding noise control are directed towards aircraft, motor vehicles and noise in general.
The California Vehicle Code sets noise emission standards for new vehicles including autos, trucks, motorcycles and off-road vehicles. Performance standards also apply to all vehicles operated on public streets and roadways. Section 216 of the Streets and Highways Code regulates traffic noise received at schools near freeways.
NOISE GOALS & PROGRAMS
Section titled “NOISE GOALS & PROGRAMS”Goal 1: To protect the existing and future citizens of Yreka from the harmful effects of exposure to excessive noise. More specifically, to protect existing noise-sensitive land uses from new uses that would generate noise levels which are incompatible with those uses, and to discourage new noise-sensitive land uses from being developed near sources of high noise levels.
Goal 2: To protect the economic base of Yreka by preventing the encroachment of noise-sensitive land uses into areas affected by existing noise-producing uses. More specifically, to recognize that noise is an inherent by-product of many industrial processes and to prevent new noise-sensitive land uses from being developed in areas affected by existing industrial noise sources.
Goal 3: To provide sufficient noise exposure information so that existing and potential future noise impacts may be effectively addressed in the land use planning and project review processes.
NOISE ELEMENT POLICIES
Section titled “NOISE ELEMENT POLICIES”Traffic and Railroad Noise Sources
Section titled “Traffic and Railroad Noise Sources”Policy 1: The interior and exterior noise level standards for noise-sensitive areas of new uses affected by traffic or railroad noise sources in the City of Yreka are shown by Table 4.
Table 5-4 – Noise Standards for New Uses Affected by Traffic and Railroad Noise City of Yreka Noise Element
| New Land Use | Outdoor Activity Area - Ldn | Interior - Ldn/Peak Hour Leq | Notes |
|---|---|---|---|
| All Residential | 60-65 | 45 | 2, 3, 4 |
| Transient Lodging | 65 | 45 | 5 |
| Hospitals & Nursing Homes | 60 | 45 | 6 |
| Theaters & Auditoriums | — | 35 | |
| Churches, Meeting Halls, Schools, Libraries, etc. | 60 | 40 | |
| Office Buildings | 65 | 45 | 7 |
| Commercial Buildings | 65 | 50 | 7 |
| Playgrounds, Parks, etc. | 70 | — | |
| Industry | 65 | 50 | 7 |
Notes:
- For traffic noise within the City of Yreka, Ldn and peak-hour Leq values are estimated to be approximately similar. Interior noise level standards are applied within noise-sensitive areas of the various land uses, with windows and doors in the closed positions.
- Outdoor activity areas for single-family residential uses are defined as back yards. For large parcels or residences with no clearly defined outdoor activity area, the standard shall be applicable within a 100 foot radius of the residence.
- For multi-family residential uses, the exterior noise level standard shall be applied at the common outdoor recreation area, such as at pools, play areas or tennis courts. Where such areas are not provided, the standards shall be applied at individual patios and balconies of the development.
- Where it is not possible to reduce noise in outdoor activity areas to 60 dB Ldn or less using a practical application of the best-available noise reduction measures, an exterior noise level of up to 65 dB Ldn may be allowed provided that available exterior noise level reduction measures have been implemented and interior noise levels are in compliance with this table.
- Outdoor activity areas of transient lodging facilities include swimming pool and picnic areas.
- Hospitals are often noise-generating uses. The exterior noise level standards for hospitals are applicable only at clearly identified areas designated for outdoor relaxation by either hospital staff or patients.
- Only the exterior spaces of these uses designated for employee or customer relaxation have any degree of sensitivity to noise.
Policy 2: Where the noise level standards of Table 4 are predicted to be exceeded at new uses proposed within the City of Yreka which are affected by traffic or railroad noise, appropriate noise mitigation measures shall be included in the project design to reduce projected noise levels to a state of compliance with the Table 4 standards.
Policy 3: Assessment of traffic noise impacts within the City of Yreka should be based on projections of traffic volumes commensurate with cumulative buildout of the City of Yreka.
Policy 4: If future railroad operations occur during nighttime hours (10 pm - 7 am), proposals for the development of new residential uses within 1000 feet of railroad grade crossings should address noise impacts in terms of the potential for sleep disturbance in addition to the Table 4 standards.
Policy 5: If an acoustical analysis is required by the City of Yreka to assess compliance with the Cty’s Noise Element standards, it shall be prepared in accordance with Table 6.
Non-Transportation Noise Sources
Section titled “Non-Transportation Noise Sources”Policy 6: The interior and exterior noise level standards for noise-sensitive areas of new uses affected by non-transportation noise sources in the City of Yreka are shown by Table 5.
Table 5-5 – Noise Standards for New Uses Affected by Non-Transportation Noise City of Yreka Noise Element
| New Land Use | Outdoor Activity Area - Leq (Daytime) | Outdoor Activity Area - Leq (Nighttime) | Interior - Leq (Day & Night) | Notes |
|---|---|---|---|---|
| All Residential | 50 | 45 | 35 | 1, 2, 7 |
| Transient Lodging | 55 | — | 40 | 3 |
| Hospitals & Nursing Homes | 50 | 45 | 35 | 4 |
| Theaters & Auditoriums | — | — | 35 | |
| Churches, Meeting Halls, Schools, Libraries, etc. | 55 | — | 40 | |
| Office Buildings | 55 | — | 45 | 5, 6 |
| Commercial Buildings | 55 | — | 45 | 5, 6 |
| Playgrounds, Parks, etc. | 65 | — | — | 6 |
| Industry | 65 | 65 | 50 | 5 |
Policy 7: The Table 5 standards are applied to both new noise-sensitive land uses and new noise-generating uses, with the responsibility for noise mitigation placed on the new use. For example, if a developer proposed construction of a new apartment complex near an existing industry, the developer would be responsible for including appropriate noise mitigation in the project design to achieve compliance with the Table 5 standards at the apartments. Conversely, if a new industry was proposed near an existing apartment complex, the industry would be responsible for including appropriate noise mitigation in the project design to achieve compliance with the Table 5 standards at the existing apartment building.
Policy 8: Where the noise level standards of Table 5 are predicted to be exceeded at new uses proposed within the City of Yreka which are affected by or include non-transportation noise sources, appropriate noise mitigation measures shall be included in the project design to reduce projected noise levels to a state of compliance with the Table 5 standards.
Construction Noise
Section titled “Construction Noise”Policy 9: Noise associated with construction activities shall be exempt from the noise standards cited in Table 5.
Policy 10: Construction activities shall be limited to the hours of 7 a.m. to 5 p.m. unless an exemption is received from the City to cover special circumstances.
Policy 11: All internal combustion engines used in conjunction with construction activities shall be muffled according to the equipment manufacturers’ requirements.
5.5. Noise Mitigation Options
Section titled “5.5. Noise Mitigation Options”Any noise problem may be considered as being composed of three basic elements: the noise source, a transmission path, and a receiver. The appropriate acoustical treatment for a given project should consider the nature of the noise source and the sensitivity of the receiver. The problem should be defined in terms of appropriate criteria (Ldn, Leq, or Lmax), the location of the sensitive receiver (inside or outside), and when the problem occurs (daytime or nighttime). Noise control techniques should then be selected to provide an acceptable noise environment for the receiving property while remaining consistent with local aesthetic standards and practical structural and economic limits. Fundamental noise control techniques include the following:
USE OF SETBACKS
Section titled “USE OF SETBACKS”Noise exposure may be reduced by increasing the distance between the noise source and receiving use. Setback areas can take the form of open space, frontage roads, recreational areas, storage yards, etc. The available noise attenuation from this technique is limited by the characteristics of the noise source, but is generally about 4 to 6 dB per doubling of distance from the source.
USE OF BARRIERS
Section titled “USE OF BARRIERS”Shielding by barriers can be obtained by placing walls, berms or other structures, such as buildings, between the noise source and the receiver. The effectiveness of a barrier depends upon blocking line-of-sight between the source and receiver, and is improved with increasing the distance the sound must travel to pass over the barrier as compared to a straight line from source to receiver. The difference between the distance over a barrier and a straight line between source and receiver is called the “path length difference,” and is the basis for calculating barrier noise reduction.
Barrier effectiveness depends upon the relative heights of the source, barrier and receiver. In general, barriers are most effective when placed close to either the receiver or the source. An intermediate barrier location yields a smaller path-length-difference for a given increase in barrier height than does a location closer to either source or receiver.
For maximum effectiveness, barriers must be continuous and relatively airtight along their length and height. To ensure that sound transmission through the barrier is insignificant, barrier mass should be about 4 lbs./square foot, although a lesser mass may be acceptable if the barrier material provides sufficient transmission loss. Satisfaction of the above criteria requires substantial and well-fitted barrier materials, placed to intercept line of sight to all significant noise sources. Earth, in the form of berms or the face of a depressed area, is also an effective barrier material.
Transparent noise barriers may be employed, and have the advantage of being aesthetically pleasing in some environments. Transparent barrier materials such as laminated glass and polycarbonate provide adequate transmission loss for most highway noise control applications. Transparent barrier materials may be flammable, and may be easily abraded. Some materials may lose transparency upon extended exposure to sunlight. Maintaining aesthetic values requires that transparent barriers be washed on a regular basis. These properties of transparent barrier materials require that the feasibility of their use be considered on a case-by-case basis.
Table 5-6 – Requirements for Acoustical Analyses Prepared in Yreka
An acoustical analysis prepared pursuant to the Noise Element shall:
- Be the responsibility of the applicant.
- Be prepared by qualified persons experienced in the fields of environmental noise assessment and architectural acoustics.
- Include representative noise level measurements with sufficient sampling periods and locations to adequately describe local conditions.
- Estimate existing and projected (cumulative City buildout) noise levels in terms of the Standards of Tables 4 and 5, and compare those levels to the adopted policies of the Noise Element.
- Recommend appropriate mitigation to achieve compliance with the adopted policies and standards of the Noise Element. Where the noise source in question consists of intermittent single events, the report must address the effects of maximum noise levels in sleeping rooms evaluating possible sleep disturbance.
- Estimate interior and exterior noise exposure after the prescribed mitigation measures have been implemented.
- Describe the post-project assessment program which could be used to evaluate the effectiveness of the proposed mitigation measures.
The attenuation provided by a barrier depends upon the frequency content of the source. Generally, higher frequencies are attenuated (reduced) more readily than lower frequencies. This results because a given barrier height is relatively large compared to the shorter wavelengths of high frequency sounds, while relatively small compared to the longer wavelengths of the frequency sounds. The effective center frequency for traffic noise is usually considered to be 550 Hz. Railroad engines, cars and horns emit noise with differing frequency content, so the effectiveness of a barrier will vary for each of these sources. Frequency analyses are necessary to properly calculate barrier effectiveness for noise from sources other than highway traffic.
There are practical limits to the noise reduction provided by barriers. For highway traffic noise, a 5 to 10 dB noise reduction may often be reasonably attained. A 15 dB noise reduction is sometimes possible, but a 20 dB noise reduction is extremely difficult to achieve. Barriers usually are provided in the form of walls, berms, or berm/wall combinations. The use of an earth berm in lieu of a solid wall may provide up to 3 dB additional attenuation over that attained by a solid wall alone, due to the absorption provided by the earth. Berm/wall combinations offer slightly better acoustical performance than solid walls, and are often preferred for aesthetic reasons.
SITE DESIGN
Section titled “SITE DESIGN”Buildings can be placed on a project site to shield other structures or areas, to remove them from noise-impacted areas, and to prevent an increase in noise level caused by reflections. The use of one building to shield another can significantly reduce overall project noise control costs, particularly if the shielding structure is insensitive to noise. As an example, carports or garages can be used to form or complement a barrier shielding adjacent dwellings or an outdoor activity area. Similarly, one residential unit can be placed to shield another so that noise reduction measures are needed for only the building closest to the noise source. Placement of outdoor activity areas within the shielded portion of a building complex, such as a central courtyard, can be an effective method of providing a quiet retreat in an otherwise noisy environment. Patios or balconies should be placed on the side of a building opposite the noise source, and “wing walls” can be added to buildings or patios to help shield sensitive uses.
Another option in site design is the placement of relatively insensitive land uses, such as commercial or storage areas, between the noise source and a more sensitive portion of the project. Examples include development of a commercial strip along a busy arterial to block noise affecting a residential area, or providing recreational vehicle storage or travel trailer parking along the noise-impacted edge of a mobile home park. If existing topography or development adjacent to the project site provides some shielding, as in the case of an existing berm, knoll or building, sensitive structures or activity areas may be placed behind those features to reduce noise control costs.
Site design should also guard against the creation of reflecting surfaces which may increase onsite noise levels. For example, two buildings placed at an angle facing a noise source may cause noise levels within that angle to increase by up to 3 dB. The open end of “U”-shaped buildings should point away from noise sources for the same reason. Landscaping walls or noise barriers located within a development may inadvertently reflect noise back to a noise-sensitive area unless carefully located. Avoidance of these problems while attaining an aesthetic site design requires close coordination between local agencies, the project engineer and architect, and the noise consultant.
BUILDING DESIGN
Section titled “BUILDING DESIGN”When structures have been located to provide maximum noise reduction by barriers or site design, noise reduction measures may still be required to achieve an acceptable interior noise environment. The cost of such measures may be reduced by placement of interior dwelling unit features. For example, bedrooms, living rooms, family rooms and other noise-sensitive portions of a dwelling can be located on the side of the unit farthest from the noise source.
Bathrooms, closets, stairwells and food preparation areas are relatively insensitive to exterior noise sources, and can be placed on the noisy side of a unit. When such techniques are employed, noise reduction requirements for the building facade can be significantly reduced, although the architect must take care to isolate the noise impacted areas by the use of partitions or doors.
In some cases, external building facades can influence reflected noise levels affecting adjacent buildings. This is primarily a problem where high-rise buildings are proposed, and the effect is most evident in urban areas, where an “urban canyon” may be created. Bell-shaped or irregular building facades and attention to the orientation of the building can reduce this effect.
NOISE REDUCTION BY BUILDING FACADES
Section titled “NOISE REDUCTION BY BUILDING FACADES”When interior noise levels are of concern in a noisy environment, noise reduction may be obtained through acoustical design of building facades. Standard residential construction practices provide 10-15 dB noise reduction for building facades with open windows, and approximately 25 dB noise reduction when windows are closed. Thus a 25 dB exterior-to-interior noise reduction can be obtained by the requirement that building design include adequate ventilation systems, allowing windows on a noise-impacted facade to remain closed under any weather condition.
Where greater noise reduction is required, acoustical treatment of the building facade is necessary. Reduction of relative window area is the most effective control technique, followed by providing acoustical glazing (thicker glass or increased air space between panes) in low air infiltration rate frames, use of fixed (non-movable) acoustical glazing or the elimination of windows. Noise transmitted through walls can be reduced by increasing wall mass (using stucco or brick in lieu of wood siding), isolating wall members by the use of double- or staggered- stud walls, or mounting interior walls on resilient channels. Noise control for exterior doorways is provided by reducing door area, using solid-core doors, and by acoustically sealing door perimeters with suitable gaskets. Roof treatments may include the use of plywood sheathing under roofing materials.
Whichever noise control techniques are employed, it is essential that attention be given to installation of weatherstripping and caulking of joints. Openings for attic or subfloor ventilation may also require acoustical treatment; tight-fitting fireplace dampers and glass doors may be needed in aircraft noise-impacted areas.
Design of acoustical treatment for building facades should be based upon analysis of the level and frequency content of the noise source. The transmission loss of each building component should be defined, and the composite noise reduction for the complete facade calculated, accounting for absorption in the receiving room. A one-third octave band analysis is a definitive method of calculating the A-weighted noise reduction of a facade.
A common measure of transmission loss is the Sound Transmission Class (STC). STC ratings are not directly comparable to A-weighted noise reduction, and must be corrected for the spectral content of the noise source. Requirements for transmission loss analyses are outlined by Title 24 of the California Code of Regulations.
USE OF VEGETATION
Section titled “USE OF VEGETATION”Trees and other vegetation are often thought to provide significant noise attenuation. However, approximately 100 feet of dense foliage (so that no visual path extends through the foliage) is required to achieve a 5 dB attenuation of traffic noise. Thus the use of vegetation as a noise barrier should not be considered a practical method of noise control unless large tracts of dense foliage are part of the existing landscape.
Vegetation can be used to acoustically “soften” intervening ground between a noise source and receiver, increasing ground absorption of sound and thus increasing the attenuation of sound with distance. Planting of trees and shrubs is also of aesthetic and psychological value, and may reduce adverse public reaction to a noise source by removing the source from view, even though noise levels will be largely unaffected. It should be noted, however, that trees planted on the top of a noise control berm can actually slightly degrade the acoustical performance of the barrier. This effect can occur when high frequency sounds are diffracted (bent) by foliage and directed downward over a barrier.
In summary, the effects of vegetation upon noise transmission are minor, and are primarily limited to increased absorption of high frequency sounds and to reducing adverse public reaction to the noise by providing aesthetic benefits.