


Housing Element
Yreka General Plan, Chapter 3
Adopted February 7, 2023
Revised August 2023
Prepared by:
PlanWest Partners, Inc
1125 16th Street, Suite 200
Arcata, CA 95521
Chapter 01 - INTRODUCTION
Section titled “Chapter 01 - INTRODUCTION”The Housing Element of the General Plan is a comprehensive statement by the City of Yreka of its current and future housing needs and proposed actions to facilitate the provision of housing to meet those needs at all income levels. The policies contained in this element are an expression of the statewide housing priority to allow for the ‘attainment of decent housing and a suitable living environment for every Californian,’ as well as a reflection of the unique concerns of the community. The purpose of the Housing Element is to establish specific goals, policies, and objectives relative to the provision of housing and to adopt an action plan toward this end. In addition, the element identifies and analyzes housing needs and resources and constraints to meeting those needs.
In an effort to ensure that adequate housing is developed to meet the needs of communities throughout the state, the California Department of Housing and Community Development (HCD) determines the housing need for regions in the state in coordination with the regions planning body known as the council of governments (COG), which then divides the regions housing need amongst the various jurisdictions. For the 6th cycle, the City of Yreka has been given a regional housing needs allocation (RHNA) of 2 housing units. This means that the City is responsible for adequately planning for 2 new units over the course of the 6th cycle (2022-2030). This is substantially less than the prior cycle for which the City had a RHNA of 103 units as shown in Table 1. To date, only seven housing units have been developed as part of the 5th cycle.
Table 1-1 Progress in Meeting 5th Cycle Regional Housing Needs Allocation
Section titled “Table 1-1 Progress in Meeting 5th Cycle Regional Housing Needs Allocation”| Income Level | 5th Cycle RHNA | Progress* | % of Progress | Remaining Need |
|---|---|---|---|---|
| Extremely Low-Income | 12 | 0 | 0% | 12 |
| Very Low-Income | 13 | 0 | 0% | 13 |
| Low-Income | 17 | 0 | 0% | 17 |
| Moderate-Income | 18 | 7 | 38.9% | 11 |
| Above Moderate- Income | 43 | 0 | 0% | 43 |
| Total | 103 | 7 | 6.8% | 96 |
Data presented in per HCD’s https://hcd.ca.gov/apr-data-dashboard-and-downloads webpage, accessed June 24, 2022
1. GUIDING POLICY
Section titled “1. GUIDING POLICY”In accordance with state law, the Housing Element is to be consistent and compatible with other General Plan elements. Additionally, the Housing Element is to provide clear policy and direction for making decisions pertaining to zoning, subdivision approval, housing allocations, and capital improvements. State law (Government Code Sections 65580 through 65589) mandates the contents of the Housing Element. By law, the Housing Element must contain:
-
An assessment of housing needs and an inventory of resources and constraints relevant to meeting those needs including the housing needs for special needs populations (Appendix A);
-
An assessment of fair housing as part of affirmatively furthering fair housing (Appendix B);
-
A statement of the community’s goals, quantified objectives, and policies relevant to the maintenance, improvement, and development of housing (Chapter 2);
-
Programs that set forth a five-year schedule of actions that the local government is undertaking or intends to undertake to implement the policies and achieve the goals and objectives of the Housing Element (Chapter 2); and
-
An evaluation of the schedule of actions from the previous Housing Element (Chapter 3).
Even though the focus of the Housing Element will be on lower- and moderate-income households, the element must also address the housing needs and policy issues for the entire community and be consistent with the adopted policies of the rest of the General Plan. Thus, the Housing Element’s focus is to balance the desires of residents, maintain neighborhood character, utilize available public services, manage traffic, and minimize visual and other impacts of new development, while addressing the needs of low- and moderate-income households and special needs groups (such as seniors and individuals with disabilities).
2. GUIDING PRINCIPLES
Section titled “2. GUIDING PRINCIPLES”The Yreka Housing Element is based on six strategic guiding principles:
- Provide a range of housing that varies sufficiently in terms of cost, design, size, location, and tenure to meet the housing needs of all economic segments of the community at a level no greater than that which can be supported by the infrastructure.
- Continue to promote housing for special needs groups. Special needs groups are defined in State law as the elderly; persons with disabilities, including a developmental disability; large families; farmworkers; families with female heads of households; and families and persons in need of emergency shelter.
- Initiate all reasonable efforts to preserve, conserve, and enhance the quality of existing dwelling units and residential neighborhoods to ensure full utilization of the city’s existing housing resources for as long as physically and economically feasible.
- Ensure that all persons, regardless of race, sex, cultural origin, age, marital status, or physical handicaps, are provided a choice of housing locations within the community.
- Pursue public and private resources available to promote diverse housing opportunities, and particularly to assist in the creation and retention of affordable housing.
- Pursue sustainable development and energy efficiency for new residential development and existing housing stock.
3. PUBLIC PARTICIPATION
Section titled “3. PUBLIC PARTICIPATION”Public participation is an important part of developing the City’s Housing Element. The information obtained through public meetings, surveys, and stakeholder interviews provide insight to the true needs of the community. While the City’s RHNA may be low, the actual need of the community may be much greater. Through the public participation process the City can identify what issues and obstacles people may be experiencing when trying to find housing. The inclusion of community stakeholders in the Housing Element public participation process helps ensure appropriate housing strategies are more efficiently and effectively evaluated, developed, and implemented. In an effort to involve all segments of the community, City staff and consultants developed a community outreach program including announcements on the City website, interviews, opportunity for housing element review and input at General Plan update events, Planning Commission and City Council workshops and hearings. Public participation played a critical role in the formulation and refinement of the City’s housing goals, policies, and programs.
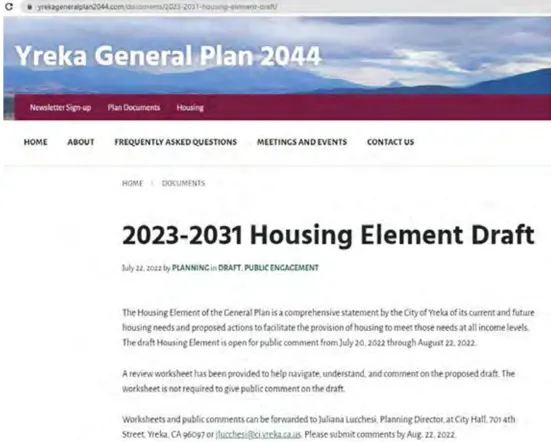
In developing the 6th Cycle Housing Element, the City conducted the following outreach efforts:
-
Public Workshop on January 26th , 2022: introduced the Housing Element and update process, reviewed recent legislation, discussed current City demographics, and gathered public input on housing needs.
-
City Council Meeting on April 19, 2022: provided overview of update process and steps taken to date, discussed initial findings from needs assessment, reviewed vacant sites inventory, gathered public input and comments from the Council.
-
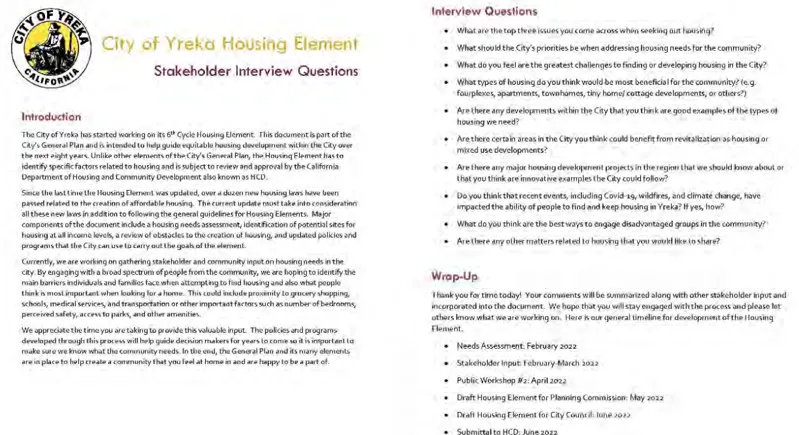
Stakeholder Interviews: City staff met with numerous individuals from the community to gather input on what types of housing are working for the area and what types of housing are needed. Two rounds of interviews were conducted including five stakeholder interviews in April 2022 and nine interviews in July 2022. Interviews were held with housing developers, property managers, community organizations focused on housing and homelessness, realtors, Tribal housing representatives, and major employers in Yreka. Appendix F contains a list of the organizations that were interviewed and their responses.
-
Coordination with the Continuum of Care network through Siskiyou County Health and Human Services to assess the needs of those experiencing homelessness. The City’s efforts include interviewing caregivers, homeless youth programming staff, and receiving input from the individuals who are homeless.
-
Coordination with Karuk Housing Authority on housing needs for the tribe and identification of properties for joint housing projects between the City and Karuk Tribal Nation.
-
Throughout the process the City included Housing Element update information on the General Plan update website and in newsletters on various issues related to the housing element and opportunities to provide input (https://yrekageneralplan2044.com/housing/).
-
Planning Commission public hearing and draft Housing Element review on July 20, 2022. Presented Public Review Draft Housing Element update and community outreach efforts to representatives of Planning Commission, received public comments and facilitated discussion with the Planning Commission.
-
City Council public hearing and draft Housing Element review on August 30, 2022. Presented Public Review Draft Housing Element update and community outreach efforts to representatives of the Council, received public comments and facilitated discussion with the Council.
Some of the issues identified through this process include the need for adequate workforce housing, low-income family housing with three or more bedrooms, programs for those experiencing homelessness, and non-vehicular access to everyday needs. These needs are incorporated into this document through policies and programs that encourage a wide range of housing types that can be accessed by individuals and families from all income levels.
The City reached out to a broad range of stakeholders including those working to address special needs housing issues, transitional and supportive housing needs, and community health issues in the City and the County. Throughout the interviews, the Project team asked interviewees about fair housing issues, and sought opinions on possible solutions to overcome constraints. The City has incorporated stakeholder feedback into its AFFH program, as well as into a variety of programs throughout the policies and programs. Department of Housing and Community Development also known as HCD.
The City of Yreka is primarily English speaking, white, and non-Hispanic (76.4% in 2020 Census), but the city is seeing an increase in diversity of its residents. Hispanic, Punjabi, and Hmong residents are increasing in representation within the city. The city did not provide translated materials for the Housing Element update due to cost and lack of staff with the ability to translate the materials. There is a strong desire by the city to provide more diverse materials for public engagement. Housing element programs having a public outreach component include provisions that commit the city to providing printed and web-based content in Spanish and other languages, as requested, to reduce language barriers for non-English speakers, and to increase the diversity of print and online engagement materials to include these growing demographics of the community. Specially, programs HE-1.3.4 (Workforce and Affordable Housing), HE-3.2.1 (Fair Housing Laws), HE-5.1.1 (Technical Assistance for Homeowners), and HE-6.1.1 (Fair Housing Information) commit the city to providing language-inclusionary materials. Program HE-3.1.1, outlines the Affirmatively Further Fair Housing (AFFH) program, with AFFH metrics and milestones detailed in Table B-1 of Appendix B. The AFFH metrics and milestones similarly commit Yreka to reducing language barriers and improving the city’s public outreach by utilizing a variety of methods. As part of the city’s General Plan update that is in the early stages, the city is including Spanish and Punjabi translation and will include additional public engagement related to housing during this process.
The city has a large population experiencing some type and severity of disability in comparison with the nation and state of California (13.1% in 2020 Census). The city did provide additional materials at community meetings that were printed in larger text, captioned online meetings, and made accommodations for those unable to stand or walk to the podium due to a physical disability.
The City did not receive new public comments since the draft Element was submitted to HCD.
4. GENERAL PLAN CONSISTENCY
Section titled “4. GENERAL PLAN CONSISTENCY”The Housing Element is one component of the City’s overall long-range planning strategy. The California Government Code requires that the General Plan contain an integrated, consistent goals and policies. State law requires that the Housing Element contain a statement of ‘the means by which consistency will be achieved with other general plan elements and community goals’ (California Government Code, Section 65583[c] [6] [B]). This requires an evaluation of two primary characteristics: (1) an identification of other General Plan goals, policies, and programs that could affect implementation of the Housing Element or that could be affected by the implementation of the Housing Element; and (2) an identification of actions to ensure consistency between the Housing Element and affected parts of other General Plan elements. The adopted 2002-2022 General Plan (adopted 2003) is being updated in conjunction with this Housing Element which will help ensure consistency between the two documents. Programs developed as part of this element will be reflected in the rest of the General Plan Update. The City will maintain this consistency in the future by ensuring General Plan amendments are evaluated for consistency with all General Plan elements.
California state law requires all elements of the General Plan, including the Housing Element, to be internally consistent and compliant with state laws (Government Code § 65300.5). The City of Yreka 2002 General Plan is set to expire in 2022. The city began a comprehensive update process in December 2021 with an expected draft General Plan complete in Fall 2023. The comprehensive update will include all required elements of a General Plan and an additional Public Services and Facilities Element. The city plans to integrate environmental justice into each Element of the General Plan instead of a stand-alone element. (Note: The City also approved the General Plan update to include environmental justice in the Public Health and Safety Element that meets the minimum requirements for SB 1000.)
SB 1000 requires cities and counties with disadvantaged communities to incorporate environmental justice related goals, policies, and objectives into their general plans. Jurisdictions can address environmental justice in general plans either in a standalone element or integrated into other general plan elements, or both. This requirement must be fulfilled upon adoption or revision of two or more general plan elements concurrently on or after January 1, 2018.
5. LOOKING AHEAD
Section titled “5. LOOKING AHEAD”During the 6th cycle planning period (2023 to 2031), the City will pursue regional collaborations to better address housing issues. Programs that implement a regional approach include HE-2.2.1 for the formation of a regional housing trust fund, and HE-3.3.1 for the preparation of a multijurisdictional assessment of fair housing. While housing issues may not be uniform between Siskiyou County and the eight cities, Yreka believes there are likely more shared issues and solutions as many housing issues do not occur in isolation or silos. Also, there are many small jurisdictions in Siskiyou county and bringing the resources to bear to prepare a legally sufficient housing element is overly burdensome. Prior to the start of the 7 th cycle, the City of Yreka would appreciate the Department of Housing and Community Development being willing to support the preparation of a regional housing element for the Siskiyou county region.
CHAPTER 02 - GOALS, POLICIES, AND PROGRAMS
Section titled “CHAPTER 02 - GOALS, POLICIES, AND PROGRAMS”This chapter of the Housing Element contains the City’s goals, policies, and the proposed strategy to implement its goals and policies. The goals and policies reflect the needs and constraints identified in the Housing Needs Assessment contained in Appendix A, including the community profile in Appendix A, Affirmatively Furthering Fair Housing in Appendix B. Available funding resources for housing are discussed in Appendix D and are integrated into City’s strategy when applicable. Each proposed implementing action contains a description of the intended action, an explanation of the responsible city department, possible sources of funding (if applicable), the time frame during which the program would take effect, and anticipated results. Whenever possible, the anticipated results have been expressed in quantified terms.
Use of the bear icon below denotes Yreka programs that are intended to fulfill a specific State housing law requirement. For quick reference, Table 2-1 below, lists the programs that are intended to meet a State housing law mandate.

Table 2-1 Programs to Meet a Specific State Law Requirement
Section titled “Table 2-1 Programs to Meet a Specific State Law Requirement”- Program HE-1.1.1
- Program HE-1.1.2
- Program HE-1.1.3
- Program HE-1.2.3
- Program HE-1.3.4
- Program HE-1.3.7
- Program HE-2.1.3
- Program HE-3.1.1
- Program HE-3.2.1
- Program HE-4.1.1
- Program HE-4.2.1
- Program HE-4.4.1
- Program HE-6.1.1
- Program HE-6.1.2
- Program HE-6.1.6
- Program HE-7.1.1
- Program HE-7.2.1
Goal HE-1
Section titled “Goal HE-1”Accommodate the City’s share of regional housing needs for all income groups during the planning period by ensuring an adequate supply of land for residential development.
Policy HE-1.1
Section titled “Policy HE-1.1”Ensure Yreka provides adequate sites with appropriate zoning and available public facilities and services to meet the City’s share of regional housing needs for all income groups during the housing element planning period and for five years of projected growth. These lands shall be available at any time with appropriate General Plan and Zoning regulations for residential development to reduce the impact that the lack of available land may have on the cost of single-family and multifamily development.
Program HE-1.1.1
Section titled “Program HE-1.1.1”
To ensure at all times during the planning period the City has an adequate inventory to accommodate its designated regional housing need allocation, the City will evaluate entitlement and permit applications seeking to develop designated inventory sites for decreases in density and affordability of housing units consistent with No Net Loss Law, Government Code Section 65863 et seq. If project approval will result in an inventory deficit, steps will be taken to replace the lost inventory sites by rezoning qualified properties in other areas as needed to meet the City’s remaining RHNA for lower-income households in accordance with Government Code Section 65863 et seq.
Administration: Planning Department, City Manager
Funding: Application fee, General Fund
Timing: On a project-by-project basis; if an inventory deficit is found
Program HE-1.1.2
Section titled “Program HE-1.1.2”
As part of the annual Housing Element review, the Planning Commission will review the City’s vacant land inventory with the objective of ensuring that Yreka can accommodate a variety of housing types, the City’s RHNA, and projected growth. If an inventory deficit is projected to occur, steps will be taken to change the General Plan and zoning as needed to increase the amount of available land. The City will publish the inventory of sites on the City’s webpage and announce the availability of the inventory to the public, including the development community.
Administration: Planning Department, City Manager
Funding: General Fund
Timing: Annually; if an inventory deficit is projected
Program HE-1.1.3
Section titled “Program HE-1.1.3”
- In compliance with State law, i.e., subparagraph (a) of Government Code Section 65589.7, the City shall deliver the adopt housing element to all public agencies that provide water and sewer service in the City of Yreka.
- The City shall grant priority for the provision of water and sewer services to proposed developments that include housing units affordable to lower income households, in compliance with State law, i.e., subparagraph (a) of Government Code Section 65589.7.
- In compliance with State law, i.e., subparagraph (b) of Government Code Section 65589.7, the City shall establish written policies and procedures that grant priority for water and sewer to proposed development that includes housing affordable to lower-income households.
Administration: Planning Department and Department of Public Works, and City Manager
Funding: General Fund
Timing: 1) Within thirty (30) days of adoption of the 2023-2031 Housing Element; 2) Immediately and at all times for the duration of the 2023-2031 Housing Element; 3) within five years from adoption of the Housing Element
Policy HE-1.2
Section titled “Policy HE-1.2”Provide a range of housing that varies sufficiently in terms of cost, design, size, location, and tenure to meet the housing needs of all economic segments of the community at a level no greater than that which can be supported by the infrastructure. To facilitate housing construction and rehabilitation of the existing housing stock, the City shall prepare amendments to the Zoning Code for by-right multifamily development that meet objective development and performance standards to reduce the time and expense of the entitlement and permitting process.
Program HE-1.2.1
Section titled “Program HE-1.2.1”The City shall amend the Zoning Code for the R-3, R-2 and RPO zones by offering ministerial review for qualified housing developments to reduce the time and expense of the entitlement and building permit process for multifamily development. The amendments will increase housing opportunities in high resource areas, and shall:
- Increase the by-right allowable density of the RPO, R-3-12 and R-2 zones from 12 dwelling units per acre to 15 dwelling units per acre.
- In the RPO, R-3 and R-2 zones allow by-right apartment or condominium housing developments with dwelling groups configured as more than 4-plexes
- Any development, design and performance standards for the R-3, R-2 and RPO zones shall be objective, and any non-objective development, design and performance standards shall be repealed.
- For sites designated in the City’s adopted affordable inventory, the Zoning Code amendments shall consider incorporation of the following requirements:
- Sites are to be developed at a minimum residential density.
- Development of a single family residence be subject to approval of an ultimate development plan demonstrating the site can accommodate multifamily development at the minimum density, including ancillary multifamily uses and development.
Administration: Planning Department, City Manager
Funding: General Fund
Timing: As part of the City’s comprehensive update of its General Plan and Zoning Code. Release of Public Draft: Q4 2023; with adoption targeted for 2024.
Quantified Objective: Construction of ten housing units, that are configured differently than detached single family units on individual lots during the 2023-2031 planning period.
Program HE-1.2.2
Section titled “Program HE-1.2.2”The City shall offer Fast Track review of entitlement and building permit applications for housing projects. The City shall complete its review of the application within 60 days after the application is complete for a project with 50 or fewer units, or within 60 days after the application is complete for a project with more than 50 units. Mixeduse development consisting of residential and nonresidential uses with at least two-thirds of the square footage designated for residential use shall be eligible for Fast Track review.
Administration: Planning Department, City Manager
Funding: General Fund
Timing: As part of the City’s comprehensive update of its General Plan and Zoning Code. Release of Public Draft: Q4 2023; with adoption targeted for 2024.
Program HE-1.2.3
Section titled “Program HE-1.2.3”
The City shall amend all applicable provisions of the Yreka Municipal Code pertaining to Accessory Dwelling Units (ADUs), including Junior Accessory Dwelling Units (JADUs), to be compliant with State law.
Administration: Planning Department
Funding: General Fund
Timing: No later than one (1) year of the date of the Department of Housing and Community Development (HCD) letter, or as part of the City’s comprehensive update of its General Plan and Zoning Code. Release of Public Draft: Q4 2023; with adoption targeted for 2024, whichever occurs first.
Policy HE-1.3
Section titled “Policy HE-1.3”Encourage infill development and adaptive reuse. The City will explore strategies to convert abandoned, vacant, and underutilized commercial and industrial sites into workforce and affordable housing, including mixed-use development.
Program HE-1.3.1
Section titled “Program HE-1.3.1”The City will amend the Zoning Code to include a mixed-use zone that will allow by-right housing development. The mixed-use zone development, design and performance standards for residential development and accessory residential development shall be objective, and will allow housing units on the ground floor by-right. During the amendment process, the City shall consider the incorporation of micro-units (approximately 350 square feet and smaller) into mixed-use designs and consider objective development standards for micro-units.
Administration: Planning Department, City Manager
Funding: General Fund
Timing: As part of the City’s comprehensive updates of the General Plan and Zoning Code. Release of Public Drafts: Q4 2023; with adoption targeted for 2024.
Program HE-1.3.2
Section titled “Program HE-1.3.2”The City will complete an inventory of sites that are appropriate for residential development and mixed-use development. The inventory will have three major categories:
- Vacant and underutilized commercial and industrial sites
- Sites eligible for up-zoning to allow up to 10 dwelling units per parcel pursuant to Government Code Section 65913.5 (SB 10, 2021)
- Sites that are eligible for ministerial streamlining pursuant to Government Code Section 65913.4 et seq.
Evaluation criteria shall prioritize:
Section titled “Evaluation criteria shall prioritize:”- The proximity to amenities, such as medical, grocery, transit, public recreation facilities, and other essentials.
- Existing infrastructure and its ability to service new residential development
- Geographic areas with reduced flooding and wildfire risk.
- Location within a designated High Resource Area per the current Tax Credit Allocation Committee mapping.
The City will consult with the development community including non-profit housing developers to determine other criteria to be used to evaluate vacant and underutilized commercial and industrial sites. Upon completion, the inventory shall be published on the City’s website to be readily accessible to the public and development community.
Administration: Planning Department, City Manager
Funding: General Fund
Timing: Creation of inventory by 2024; Annual review and update as needed.
Program HE-1.3.3
Section titled “Program HE-1.3.3”The City will offer a voluntary rezoning program as part of the General Plan update. The rezoning program will have two categories for sites identified in the Program HE-1.4.2 inventory:
- Sites that are vacant and underutilized commercial and industrial properties.
- Sites eligible for up-zoning to allow up to 10 dwelling units per parcel pursuant to Government Code Section 65913.5 (SB 10, 2021)
The City will engage property owners of identified sites to discuss opportunities to allow by-right multifamily housing. For willing property owners, the City will offer a rezoning program that includes the City underwriting the rezoning costs to amend the land use regulations for volunteered properties to encourage property owner participation.
Administration: Planning Department, City Manager
Funding: General Fund
Timing: As part of the City’s comprehensive updates of the General Plan and Zoning Code. Release of Public Drafts: Q4 2023; with adoption targeted for 2024.
Program HE-1.3.4
Section titled “Program HE-1.3.4”
The City will improve awareness and support for the City’s workforce and affordable housing programs citywide by publicly sharing information on the City’s website about zoning ordinances, development standards, fees, exactions, surplus public lands, fair housing resources, and housing affordability requirements. This program will be implemented consistent with the requirements of AB 1483 (2019). To improve the dissemination of the City’s affordable housing programs, the City will provide information, printed and as web content, in Spanish and other languages, as requested, to reduce barriers for non-English speakers. The City will perform proactive public outreach using a variety of methods that may include in-person or virtual participation, e.g., development industry events or workshops, and direct contact with developers and property owners to improve the dissemination of information about the City’s affordable housing programs.
Administration: Planning Department, City Manager
Funding: General Fund
Timing: Within one year from adoption of the Housing Element. To improve awareness of the City’s affordable housing programs, the City will participate in an industry event, workshop, or similar public event/activity at least once a year beginning in 2025.
Program HE-1.3.5
Section titled “Program HE-1.3.5”The City will consider adoption of a housing impact fee ordinance or an inclusionary housing ordinance that includes an allowance for payment of an in-lieu fee. A housing impact fee ordinance, if enacted would enable the City to charge developers a fee for each square foot of new market-rate construction and use the funds to pay for affordable housing. A housing impact fee is structured to require payment of fees rather than development of units onsite. An inclusionary housing ordinance, if enacted, increases the supply of affordable units by requiring developers to reserve a certain percentage of housing units for very low, low, and moderate-income households in new residential developments, or pay an in-lieu fee. In-lieu fees are typically deposited into a housing trust fund where they can be used to finance affordable housing development.
For either option the City will prepare background studies. The background studies will include an evaluation of the financial feasibility and resource requirements to implement either a housing impact fee or an inclusionary housing ordinance. The feasibility analysis will also assess the impact of a fee or ordinance on the financial feasibility of a prototype rental project in Yreka (similar to what a developer would do when considering a marketrate housing project). The financial feasibility study should include a pro forma analysis (i.e., a comparison of development costs and rental revenues) of a prototype rental development to determine if a housing impact fee or an inclusionary housing ordinance would affect the financial feasibility of development. For either approach, the City may consider allocating collected funds to a local housing trust fund where the funds can be used to finance affordable housing development.
Administration: Planning Department, City Manager
Funding: General Fund
Timing: As part of the City’s comprehensive update of its General Plan and Zoning Code. Release of Public Draft: Q4 2023; with adoption targeted for 2024.
Program HE-1.3.6
Section titled “Program HE-1.3.6”The City shall consider a vote of Article XXXIV of the State Constitution (Article 34) to remove regulatory barriers for publicly-owned affordable rental housing. The City will support the State and/or local initiatives and referendums to allow the electorate of Yreka to vote in a state-wide or local election on the potential repeal of Article 34 of the State Constitution. Should the State or local initiatives or referendums fail to progress or pass, the City shall initiate an Article 34 initiative that, if passed by a majority of qualified voters, would allow the City to develop, construct or acquire low cost rental housing, or to partner with non-profit housing developers using State funding.
Administration: Planning Department, City Manager
Funding: General Fund
Timing: Completed in accordance with the Siskiyou County office of elections deadlines for inclusion on the November 2028 General Election ballot.
Program HE-1.3.7
Section titled “Program HE-1.3.7”
The City shall implement Government Code Section 65913.4 et seq., the Streamlined Ministerial Approval Process, also referred to as SB 35. To implement SB 35, the City shall prepare written procedures and forms meeting the requirements of state law. The City shall publish its SB 35 procedures on its website, and shall make its SB 35 forms and materials available for download on the website. Printed copies of the City’s procedures, forms and other related materials shall be made available at the Planning Department’s public information counter also.
Administration: Planning Department, City Manager
Funding: General Fund
Timing: Within one year from adoption of the 6th cycle housing element.
Goal HE-2
Section titled “Goal HE-2”Encourage the provision and production of workforce and affordable housing. To increase workforce and other affordable housing opportunities within Yreka’s existing housing stock the City will support the production of 250 new workforce housing units by 2030.
Policy HE-2.1
Section titled “Policy HE-2.1”The City will assist in the development of workforce and affordable housing through site identification, supporting funding applications, land donation, expedited permit review, approval of requests density bonus or development incentives, direct funding when feasible, and other incentives. The City will work with the Karuk Tribe Housing Authority, market rate and nonprofit housing developers, and community organizations to develop workforce and affordable housing.
Program HE-2.1.1
Section titled “Program HE-2.1.1”The City shall complete an inventory of City-owned properties that are no longer needed for current or foreseeable future public operations and are excess. If the inventory identifies excess City-owned properties, the City will commence the process of surplusing and disposing of the properties in accordance with Government Code Sections 54220-54234. Properties shall be made available for the development of affordable housing to the maximum extent feasible. The City shall encourage other public entities to inventory excess properties and make them available for affordable housing in accordance with Government Code Sections 54220-54234.
Administration: Planning Department, Department of Public Works, City Manager
Funding: General Fund, and other state and federal funds identified for specific projects/planning activities such as Community Development Block Grant, Home Investment Partnership Program (HOME), California Housing Finance Agency (CalHFA) programs, CalHome Program.
Timing: The process of inventorying City-owned shall commence within one year of Housing Element adoption, and shall be completed 18 months after commencement. City-owned properties that are identified in the inventory will be made available within one (1) year from when the inventory is complete
Program HE-2.1.2
Section titled “Program HE-2.1.2”The City will adopt a fee deferral Code that will offer waivers or deferrals of City-controlled impact fees for housing developments that include a specified minimum percentage of workforce and affordable dwelling units.
Administration: Planning Department, City Manager
Funding: General Fund
Timing: As part of the City’s comprehensive updates of the General Plan and Zoning Code. Release of Public Drafts: Q4 2023; with adoption targeted for 2025.
Objective: Subsidize up to 60 housing units over a period of five years
Program HE-2.1.3
Section titled “Program HE-2.1.3”
- The City shall provide density bonuses to homebuilders proposing to include qualifying dwelling units within residential developments consistent with Government Code Section 65915 et seq.
-
- The City shall review Chapter 16.78 of Title 16, Yreka Municipal Code, to ensure compliance with State Density Bonus Law, Government Code Section 65915 et seq. If needed, the City shall prepare amendments to Chapter 16.78 of Title 16, Yreka Municipal Code to ensure compliance with State law.
- During the planning period, The City shall monitor State law for amendments to density bonus law, Government Code Section 65915, to ensure ongoing compliance with State law. If State law is amended such that revisions to the City of Yreka's Zoning Code are necessary for legal compliance, the City will initiate amendments to Title 16 of the Yreka Municipal Code.
- The City will prepare and publish materials on the City’s website informing property owners and housing developers of the City’s density bonus program for qualified housing developments.
Administration: Planning Department, City Manager
Funding: General Fund
Timing: 1) At all times during the 6th cycle. 2a) By Q2 of 2023; 2b) annually, with amendments to Title 16 of the Yreka Municipal Code as needed. 3) To be completed by Q4 of 2024.
Program HE-2.1.4
Section titled “Program HE-2.1.4”The City shall prepare amendments to the Title 16 of the Yreka Municipal Code to allow small and large employee housing by-right CPO, C-2, CH, and CT zones when located within a distance a person can reasonably walk to services (e.g., a quarter mile) or a transit stop is within a quarter mile of the development, and that meets other applicable zoning requirements for employee housing. Employee housing proposed in CPO, C-2, CH, and CT zones and to be located at a greater walking distance shall be subject to a use permit. All development and performance standards shall be objective.
Administration: Planning and Building Department
Funding: General Fund
Timing: As part of the City’s update of its General Plan. Release of Public Draft: Q4 2023; with adoption targeted for 2024.
Program HE-2.1.5
Section titled “Program HE-2.1.5”The City will provide assistance to developers who are preparing funding applications for workforce and affordable housing projects, including housing for extremely low income and special needs households, that require a public agency applicant. The City will also consider providing staff support in providing needed information for funding requests to increase the likelihood of receiving state or federal funding. City staff is available to meet with nonprofit and for-profit affordable housing providers to determine their interest in, and plans for, constructing affordable housing in Yreka, including developing infill sites or converting nonresidential buildings. Based on the clients to be served by proposed projects and the type of housing and services to be incorporated into funding requests, the City will assist the housing provider in identifying the most appropriate state and/or federal funding sources.
Administration: Planning Department, City Manager, Finance Department
Funding: General fund and various state or federal programs, depending on the clients to be served and the type of housing to be provided. May include Community Development Block Grant (CDBG) and HOME programs (federal funds administered by the State of California for non-entitlement cities and counties), the Multifamily Housing Program, California Housing Finance Agency programs (such as HELP), tax-exempt bond financing, low-income housing tax credits, the Federal Home Loan Bank Affordable Housing Program, USDA and other funding for farmworker housing, and various other US Department of Housing and Urban Development programs for special needs groups.
Timing: Annual contact with affordable housing providers through the planning period; additional contacts as needed to discuss project-specific issues.
Policy HE-2.2
Section titled “Policy HE-2.2”The City will advocate and participate in the creation of a Siskiyou Regional Housing Trust Fund for the creation and preservation of affordable housing. The formation of a regional housing trust fund is a starting point for creating a local funding source for the development of workforce and affordable housing, housing rehabilitation, and enable local housing projects to be eligible to apply for Local Housing Trust Fund program funding administered by the State.
Program HE-2.2.1
Section titled “Program HE-2.2.1”The City shall coordinate and collaborate with Siskiyou County and the eight cities in Siskiyou county for the establishment of a regional housing trust fund. A housing trust fund means a public, joint public and private fund or charitable nonprofit organization described in 2.5.2.18. Section 501(c)(3) of the Internal Revenue Code, established by legislation, Code, resolution (including nonprofit articles of incorporation), or a public-private partnership organized to receive specific revenue to address local or regional housing needs.
Administration: Planning Department, City Manager
Funding: General Fund
Timing: Initiate within two years, i.e., by December 2025, from the adoption of the Housing Element, with outreach to the Siskiyou County and the eight cities occurring at least annually until 2031.
Policy HE-2.3
Section titled “Policy HE-2.3”The City shall support and encourage the development and construction industries to implement new technologies and opportunities to build housing that is more affordable by design, that make more efficient use of land and materials, including water conserving systems, energy systems, dwelling designs, and uses of recycled materials for building. The City shall also encourage and support sweat-equity and collaborative construction methods.
Program HE-2.3.1
Section titled “Program HE-2.3.1”- Support Workforce Pathways into the Construction Industry in Yreka and Siskiyou County. The City shall support local efforts to expand the construction workforce.
- Promote the use of energy conservation measures in all housing through the use of public and private weatherization programs. Provide information on currently available weatherization and energy conservation programs to residents of the city. The City will have information available for the public at the front counter of City Hall and will distribute information through an annual mailing.
- Continue to enforce state requirements, including Title 24 of the California Code of Regulations, for energy conservation in new residential projects and encourage residential developers to employ additional energy conservation measures for the siting of buildings, landscaping, and solar access through development standards contained in the Zoning Ordinance, Building Code, and Specific Plans as appropriate.
Administration: Planning Department, Building Department, City Manager
Funding: General Fund
Timing: 1) 2023-2031; 2) Initiate no later than December 2025; 3) Because this is a current building code requirement, the City will implement it as part of the building permit application and review process.
Program HE-2.3.2
Section titled “Program HE-2.3.2”The City will prepare amendments to the Yreka Municipal Code for adaptive reuse to increase the flexibility of the zoning regulations to encourage the adaptive reuse of vacant or underutilized commercial buildings to housing. To incentivize conversion and reuse of underutilized commercial buildings to workforce housing, the amendments will consider development and adoption of alternative building standards that are designed to provide a reasonable level of safety to the building occupants and conformance with California Health and Safe Code Section 17958.11.
Administration: Planning Department, Building Department, City Manager
Funding: General Fund
Timing: As part of the City’s update of its General Plan. Release of Public Draft: Q4 2023; with adoption targeted for 2024.
Goal HE-3
Section titled “Goal HE-3”Take actions to address significant disparities in housing needs and in access to opportunity for all persons regardless of race, religion, sex, marital status, ancestry, national origin, color, familial status, or disability.
Program HE-3.1.1
Section titled “Program HE-3.1.1”
In an effort to affirmatively further fair housing (AFFH), the City will implement the AFFH Action Plan in Table 22 that will take actions to address significant disparities in housing needs and in access to opportunity, replacing segregated living patterns with truly integrated and balanced living patterns, transforming areas of concentrated poverty into areas of opportunity, and fostering and maintaining compliance with civil rights and fair-housing laws for all persons in accordance with state and federal law. Appendix B analyzes fair housing conditions in the City of Yreka, and provides a regional comparison. Section 5 of Appendix B enumerates the City’s fair housing issues and contributing factors, and the contributing factors are prioritized in Section 5 of Appendix B. Finally, section 5 of Appendix B references the City’s AFFH Action Plan that is listed in Table 2-2 below that addresses the enumerated fair housing issue and contributing factor.
Table 2-2 City of Yreka Affirmatively Further Housing Action Plan
Section titled “Table 2-2 City of Yreka Affirmatively Further Housing Action Plan”| Id # | City AFFH Action | Geographic Targets | Deliverable(s) & Metrics for Determining Success | Timeline |
|---|---|---|---|---|
| 1 | Metrics: Track efficacy of AFFH actions, and make adjustments as needed. | Citywide | Annual reporting to the Planning Commission and annual adjustments to increase goal attainment | First annual report in 2024 with the housing element annual progress report |
New Opportunities in High Resource Areas
| Id # | City AFFH Action | Geographic Targets | Deliverable(s) & Metrics for Determining Success | Timeline |
|---|---|---|---|---|
| 2.a | Remove barriers to housing choice, and improve housing affordability and mobility by increasing the availability of workforce and affordable housing in areas of opportunity. | Citywide and areas near Yreka’s high resource areas, i.e., the downtown area and generally northwestern neighborhoods. | The City will continue to collaborate with the County and nonprofit housing organizations and developers to encourage development of affordable workforce housing development, including rehabilitation and adaptive reuse. The City will meet the County and nonprofit housing organizations and developers no less than twice a year, and will provide summaries of meetings to the Planning Commission. | Convene first meeting within 24 months of adoption of housing element, and provide summaries with the housing element annual progress report (HE APR) thereafter. |
| 2.b | Remove barriers to housing choice, and improve housing affordability and mobility for workforce and affordable housing by:
|
Citywide and areas near Yreka’s high resource areas, i.e., the downtown area and generally northwestern neighborhoods. |
|
|
| 2.c | Remove barriers and improve housing choice and mobility for residents by developing a referral program. | Citywide, and residents residing in Yreka’s high resource areas. | Develop a program administered by the City or by partnering with a qualified organization to connect lower-income households and individuals, including extremely low income residents with affordable rental and homeownership opportunities in the City. Features of the program would include:
|
Launch program by 2025. |
Fair Housing Outreach and Dissemination of Fair Housing Information
| Id # | City AFFH Action | Geographic Targets | Deliverable(s) & Metrics for Determining Success | Timeline |
|---|---|---|---|---|
| 3.a | Improve AFFH outreach and reduce displacement by improved dissemination of fair housing resources.1 | Citywide | Support non-profit organizations that provide multi-lingual landlord/tenant mediation, foreclosure assistance, or tenant legal counseling services. The city will meet with the housing authorities of Shasta County and the Karuk Tribe at least twice per year to discuss Housing Choice Voucher and Project-Based Voucher needs, affirmative marketing and outreach activities, and methods of increasing the number of vouchers allocated to the city. Facilitate new construction, or conversion, of four housing units affordable to lower income households. |
Convene first meeting within 24 months of adoption of housing element, and meet with organizations at least biannually thereafter during the 2023-2031 planning period. Housing units to be developed during the 2023-2031 planning period. |
| 3.b | Improve fair housing awareness of residents to reduce displacement by informing residents of fair housing resources, including fair housing assistance programs, fair housing rights and remedies, and the range of fair housing incentives available in Yreka. | Citywide, and residents residing in Yreka’s low resource areas, e.g., neighborhoods east of Interstate 5 and Fairchild Hospital neighborhoods. | The City will make information on fair housing available to the public, through the posting of fair housing information in City Hall and in other public buildings, on the City’s website, distribution to existing and new apartment complexes, publishing information and materials on the City’s website, and inserting information in the City’s newsletter. The City will provide fair housing materials, printed and as web content, in Spanish and other languages. Materials will depict members of protected classes under fair housing laws. The City will perform proactive public outreach by attending community events, workshops and through direct contact with property owners and tenants. Increase fair housing awareness by increasing inquires by two inquires annually. |
The City will update the website by Q3 2024. Distribute information annually. The City will participate in a community event, workshop, or similar public event/activity at least once a year beginning in 2025. |
| 3.c | Improve fair housing resources by developing an AFFH brochure that informs residents of fair housing resources. | Citywide, and residents residing in Yreka’s low resource areas, e.g., neighborhoods east of Interstate 5 and Fairchild Hospital neighborhoods. | Develop an AFFH brochure and other fair housing resources. Include brochures with utility billing at least twice during the 2023-2031 planning period. Place printed brochures and other AFFH materials at multiple venues, such as City Hall, libraries, and public counters of social service organizations. | First annual report no later than 2025 as part of the HE APR, annually thereafter as part of the HE APR. |
| 3.d | Improve fair housing awareness and reduce language barriers by providing fair housing resources and housing opportunities to English and non-English speakers. | Citywide, and residents residing in Yreka’s low resource areas, e.g., neighborhoods east of Interstate 5 and Fairchild Hospital neighborhoods. | Provide printed materials and web content on fair housing and housing opportunities in Spanish and other languages, as requested. Purchase translation software or subscribe to a translation service, and translate fair housing resources for residents. Complete purchase by December 31, 2023. Distribute, publish, and post translated materials within six months following purchase. Thereafter, review annually and update as needed. |
First annual report no later than 2025 as part of the housing element annual progress report, annually thereafter as part of the HE APR. |
| 3.e | Improve fair housing awareness by distributing information about AFFH and fair housing to City staff, elected officials, and appointees for consistent implementation. | Citywide | Provide training for staff, elected officials, and appointees on issues of fair housing. City Council meetings will include a fair housing presentation at least biennially. | Begin in calendar year 2025 |
Conservation and Revitalization
| Id # | City AFFH Action | Geographic Targets | Deliverable(s) & Metrics for Determining Success | Timeline |
|---|---|---|---|---|
| 4.a | Conserve and improve the existing housing stock through proactive code enforcement to result in unit rehabilitation to improve habitability of housing that is affordable. | Citywide, and residents residing in Yreka’s low resource areas, e.g., neighborhoods east of Interstate 5 and Fairchild Hospital neighborhoods. | Develop a proactive code enforcement program that focuses on areas having concentrated rehabilitation needs. Program implementation is to result in repairs and retention of housing, and mitigates potential cost, displacement, and relocation impacts on residents. Facilitate the conservation/rehabilitation of four housing units during the planning period of 2023 to 2031. |
Begin in calendar year 2025, and provide summaries to the Planning Commission no less than annually as part of the HE APR. |
| 4.b | Reduce displacement of residents by implementing Replacement Housing law | Citywide including Yreka’s high resource areas, e.g., near Yreka’s downtown area and generally northwestern neighborhoods. | Areas targeted for growth (e.g., such as job and housing rich areas, revitalization areas) the City will implement replacement housing requirements consistent with the provisions of Gov’t Code Section 66300 as a city subject to the provisions of the Housing Crisis Act (see Program HE-4.4.1). Existing housing units (or units removed within five years of a development application) will be replaced one-for-one and in a manner consistent with the provisions of the cited Gov’t Code Section. |
First annual report in 2024, then annual with the HE APR |
| 5.a | Targeted investment using available state and federal funding for neighborhood revitalization and conservation of the existing housing stock to transform low resource areas to high resource areas. | Yreka’s low resource areas, e.g., residents and neighborhoods east of Interstate 5. | Seek state and federal funding to improve infrastructure and access to opportunity in areas not currently designated as high resource. Complete four infrastructure and/or public facility projects by 2031. | City will apply for appropriate state and federal infrastructure funding annually. |
| 5.b | Reduce poverty by improving the creation of jobs. | Citywide, and residents residing in Yreka’s low resource areas, e.g., neighborhoods east of Interstate 5 and Fairchild Hospital neighborhoods. | The City shall support efforts to connect low-income residents with financial empowerment resources, homeownership programs, small business assistance, living wage jobs, and workforce training resources and services. The City will meet with local and regional economic development agencies and organizations at least twice per year to discuss existing economic development projects and prospective projects that are available for residents in order to provide referrals. The City will refer four residents to the Siskiyou Economic Development Council, USDA Rural Development, and Small Business Development Center for services annually. |
Convene first meeting within 24 months of adoption of housing element, and meet with organizations at least biannually thereafter during the 2023-2031 planning period. |
| 5.c | Improve housing mobility and encourage neighborhood revitalization by creating more inclusive and equitable neighborhoods, and increase access to opportunity. | Citywide, and residents residing in Yreka’s low resource areas, e.g., neighborhoods east of Interstate 5 and Fairchild Hospital neighborhoods. | By the end of 2023, the City will convene meetings with representative groups of community residents, including non-English speakers, to identify housing needs and solutions at the neighborhood level, particularly in areas targeted for inclusive economic and community development. The City will convene these meetings at least two meetings per year. | First annual report no later than 2024 as part of the HE APR, annually thereafter as part of the HE APR. |
| 5.d | Protect existing residents from displacement, and increase the opportunity for qualified residents to reside in affordable units. | Citywide, and residents residing in Yreka’s low resource areas, e.g., neighborhoods east of Interstate 5 and Fairchild Hospital neighborhoods. | Increase eligible resident use of tenant-based Housing Choice Vouchers (HCV) by including information about HCV on the City website and public counters. Website to include information and resources for both tenants and landlords. Increase the number of Yreka applicants for vouchers by at least 5 percent by 2031. |
Update the website by 2024. |
Policy HE-3.2
Section titled “Policy HE-3.2”Eliminate housing discrimination based on race, color, religion, sex, national origin, ancestry, marital status, age, household composition or size, or any other arbitrary factor.
Program HE-3.2.1
Section titled “Program HE-3.2.1”
(Program HE-3.2.1 is the same program as HE-6.1.1 below)
- Continue to support the enforcement of the fair housing laws to protect against housing discrimination by providing adequate information about renters’ rights, and promote equal housing opportunity.
- The City will provide a referral service to those who handle complaints against discrimination. Such complaints are to be filed with the City Manager.
- To improve the dissemination of fair housing information, the City will make information on fair housing available to the public, through the posting of fair housing information in City Hall and in other public buildings, on the City’s website, distribution to existing apartment complexes, and publishing information and materials on the City’s website. The City will provide fair housing materials, printed and as web content, in Spanish and other languages, as requested, to reduce barriers for non-English speakers.
- The City will perform proactive public outreach using a variety of methods, e.g., community events, workshops and direct contact with developers, property owners, and tenants, to improve the dissemination of fair housing information, laws, and resources.
Accountability: City Manager
Funding: General Fund
Timing: 1) and 2) and 3) 2023-2031: materials and information about the City’s procedures for requesting reasonable accommodation from the Title 16 - Zoning, Yreka Municipal Code will be made available on the City’s website within 120 days of the effective date. 4) Commence no later than Q3 2024, and no less than annually thereafter.
Policy HE-3.3
Section titled “Policy HE-3.3”Regional collaboration is a more meaningful and effective approach for assessing fair housing issues because fair housing issues do not recognize jurisdictional boundaries. In advance of the start of the 7 th housing element cycle, the City will support preparation of a regional assessment of fair housing, the development of coordinated programs including those that enable joint funding opportunities.
Program HE-3.3.1
Section titled “Program HE-3.3.1”The City shall coordinate with Siskiyou County and the other eight cities for the completion of a multijurisdictional assessment of fair housing (AFH) that meets the requirements of Government Code Section 65583(c)(9(A). The completed AFH is to be adequate so participating jurisdictions may incorporate it into their 7 th cycle housing elements. The multijurisdictional AFH will identify elements and factors that cause, increase, contribute to, maintain, or perpetuate segregation, racially or ethnically concentrated areas of poverty, significant disparities in access to opportunity, and disproportionate housing needs, and recommend a program(s) to address identified fair housing issues.
Administration: Planning Department, City Manager
Funding: General Fund
Timing: Commencing either no later than January 2031 or prior to the start of Siskiyou county’s 7 th housing element cycle projection period, whichever occurs first.
Goal HE-4
Section titled “Goal HE-4”Preserve, maintain, rehabilitate, and enhance the quality of existing dwelling units and residential neighborhoods to ensure full utilization of the city’s existing housing resources for as long as physically and economically feasible.
Policy HE-4.1
Section titled “Policy HE-4.1”Establish a procedure that provides adequate notice, relocation, and other assistance for mobile home park residents consistent with State law in the event a mobile home park is to be converted to another use.
Program HE-4.1.1
Section titled “Program HE-4.1.1”
The City shall adopt a mobile home park conversion ordinance to establish a procedure is to ensure that any conversion of mobile home parks to other uses is preceded by adequate notice, and that relocation and other assistance is provided park residents, consistent with the provisions of the California Government Code, Section 65863.7 and including the actions described in Program HE-4.2.1, (2) and (3) to minimize displacement of residents.
Administration: Planning Department
Funding: General Fund
Timing: As part of the City’s comprehensive updates of the General Plan and Zoning Code. Release of Public Draft: Q4 2023; with adoption targeted for 2024.
Quantified Objective: No net loss of existing mobile home parks during the 2023-2031 planning period.
Policy HE-4.2
Section titled “Policy HE-4.2”The City shall prioritize the preservation of existing affordable housing at risk of loss of affordability covenants as a critical means of mitigating the displacement and loss of affordable housing units from the City’s inventory.
Program HE-4.2.1
Section titled “Program HE-4.2.1”
The City will take the following actions to mitigate the potential conversion of assisted affordable units, such as the Deer Creek apartments, to market-rate units.
- The City will coordinate with owners of expiring subsidies to ensure tenants receive the required notices at 3 years, 6 months, and 12 months, per California law. The owner will be required to provide written notification to residents of the expected date of loan prepayment or payoff, at which time the owner will no longer be restricted in the level of rent that can be charged. The notice will also contain an estimate of rent increases at the time rental restrictions no longer apply. Residents moving into a housing development during this one-year period must also be notified in writing of the pending conversion prior to signing a rental agreement.
- Property owners will provide relocation assistance to those low-income households who are unable to afford rent increases.
- If an affordable housing project indicates it is opting out of its affordability restrictions, the City will ensure that affected residents receive notification of the owner’s intent and will provide nonfinancial assistance with relocation.
- The City will solicit interested nonprofit housing corporations and local housing authorities to acquire and maintain such projects as low-income housing, including extremely low income housing and special needs households. The City will assist an interested nonprofit housing corporation or housing authority in applying for state or federal assistance for acquisition.
Administration: Planning Department and City Manager
Funding: California Housing Finance Agency Preservation, Acquisition Financing Mortgage Insurance for Purchase/Refinance (HUD)
Time Frame: Contact property owners by December 31, 2023, to determine future ownership plans; implement preservation strategy if owners indicate desire to sell or convert their properties.
Policy HE-4.3
Section titled “Policy HE-4.3”Rehabilitation and Preservation. The City shall use preservation, conversion, and/or rehabilitation as tools to improve substandard single-unit homes and multi-unit affordable housing to preserve the existing housing stock and affordability.
Program HE-4.3.1
Section titled “Program HE-4.3.1”- Using accepted best practices, the City shall conduct a housing conditions survey. The survey will also identify housing units and/or neighborhoods where there may be concentrations of substandard housing to assist with the prioritization of funding for rehabilitation of housing units.
-
- The City shall develop an owner-occupied rehabilitation (OOR) program and apply for funding. If the City has available program income and OOR is an eligible use of program income per the grantor, the City's program income guidelines shall be amended to include an OOR activity, and allocating a portion of program income to the OOR activity.
- Tax Credit Allocation Committee (TCAC) designated low resource areas and neighborhoods where substandard housing is concentrated shall be prioritized for funding for rehabilitation of housing units.
- Upon securing funding, the City will implement affirmative marketing of the OOR program. An affirmative marketing program will include:
- Advertising the availability of program in multiple languages, and advertise in various media outlets, such as newspapers, magazines, radio, or online platforms, that reach a wide and varied audience.
- Provide information about the program to potential applicants in multiple languages
- Offering reasonable accommodations to persons with disabilities to ensure equal opportunity to apply.
- Creating materials that feature images and messages that appeal to a diverse range of potential applicants.
Administration: Planning Department
Funding: General Fund
Timing: 1) To be completed by Q1 2023; 2) The City will develop the OOR program by December 2025. Beginning in January 2026, the City will annually apply for state and/or federal funding that allows awarded funds to be used for OOR. Grant applications to reflect that the OOR will be implemented with the priorities described in 2b) and that the OOR program will be affirmatively marketed as described in 3); 3) Upon securing funding to implement an OOR program.
Quantified Objective: Rehabilitate four homes during the 2023-2031 planning period.
Program HE-4.3.2
Section titled “Program HE-4.3.2”Utilize the code enforcement program as a means of keeping track of the condition of the city’s housing stock. This, along with periodic review by the Planning Commission and the City Council of residential areas needing improvements, could identify needed code enforcement, necessary improvements to city infrastructure, and/or the opportunity to obtain financing for improvements. As feasible, the City will continue to prioritize code enforcement and provide adequate funding and staffing to support code enforcement programs. (This program was identified as Program HE.3.1.3 in the previous housing element)
Administration: City Manager, Building Department, Planning Department
Funding: General Fund
Timing: To be completed by December 2025.
Policy HE-4.4
Section titled “Policy HE-4.4”To mitigate the loss of affordable housing units on inventory sites, the City shall immediately begin implementing replacement housing, when applicable, pursuant to Government Code Section 65583.2(g)(3) and adopt a local policy. The replacement housing policy requires new housing developments to replace all affordable housing units lost due to new development.
Program HE-4.4.1
Section titled “Program HE-4.4.1”
The City shall prepare and adopt a replacement housing policy consistent with Government Code Section 65583.2(g)(3). The City will adopt a policy and will require replacement housing units subject to the requirements of Government Code section 65915, subdivision (c)(3) on sites identified in the site inventory when any new development (residential, mixed-use, or nonresidential) occurs on a site that is identified in the inventory meeting the following conditions:
- Currently has residential uses or within the past five years has had residential uses that have been vacated or demolished, and
- Was subject to a recorded covenant, ordinance, or law that restricts rents to levels affordable to persons and families of low or very low-income, or
- Subject to any other form of rent or price control through a public entity’s valid exercise of its police power, or
- Occupied by low or very low-income households.
The City’s policy will also consider how to provide disclosure for properties subject to replacement housing for future property owners.
Administration: Planning Department
Funding: General Fund
Timeframes: The replacement requirement will be implemented immediately and applied as applications on identified sites are received and processed, and local policy shall be adopted by January 1, 2026.
Goal HE-5
Section titled “Goal HE-5”Encourage diverse housing opportunities by promoting the creation and retention of affordable workforce housing, housing that is affordable by design, and designs for shared and intergenerational housing, including pursuing available public and private resources.
Policy HE-5.1
Section titled “Policy HE-5.1”The City shall promote accessory dwelling units and SB 9 (2021) housing development by developing tools, resources, and educational materials to increase awareness and support, with the objective of increasing the development of Accessory Dwelling Units (ADUs) and SB 9 (2021) housing developments in neighborhoods throughout the City.
Program HE-5.1.1
Section titled “Program HE-5.1.1”The City shall initiate a technical assistance program for homeowners to facilitate and accelerate the development of ADUs, JADUs, and SB 9 (2021) housing units on their property. Components of the technical assistance program will include a toolkit and a public outreach plan:
- Develop access to an online inventory of pre-approved ADU plans. The City will obtain permission for use and publication from other California jurisdictions. The City building official will perform plan checks and develop a corrections list, as needed, to ensure compliance with local building regulations.
- Pre-screen parcels at a programmatic level using readily available public information to identify parcels eligible for SB 9 (2021) housing developments and ministerial lot splits.
- Development of customer-oriented online tools and resources to disseminate information about the ADU and SB 9 development.
- Internal staff training
- Consultation with local lending institutions, and recruitment of ADU and SB 9 ambassadors.
- To improve the dissemination of the City’s technical assistance program for ADUs, JADUs, and SB 9 (2021) housing, the City will provide information, printed and as web content, in Spanish and other languages, as requested, to reduce barriers for non-English speakers.
- The City will perform proactive public outreach using a variety of methods, e.g., community events such as a farmer’s market, workshops and direct contact with developers and property owners to improve the dissemination of information about the City’s technical assistance program for ADUs, JADUs, and SB 9 (2021) housing.
Administration: Planning Department, City Manager
Funding: General Fund, LEAP and REAP
Timing: Initiate within 18 months of adoption of the housing element and complete by 2024. To improve resident awareness of the City ADUs, JADUs, and SB 9 (2021) housing programs, the City will participate in a community event, workshop, or similar public event/activity at least once a year beginning in 2025.
Program HE-5.1.2
Section titled “Program HE-5.1.2”The City shall apply for State program funding that allows awarded funds to be used to support the development of accessory dwelling units (including junior accessory dwelling units), e.g., CalHOME.
Administration: Planning Department, City Manager
Funding: General Fund, LEAP and REAP
Timing: Initiate within 18 months of adoption of the 2023-2031 housing element. The City will annually apply for state funding that allows awarded funds to be used to support the development of accessory dwelling units (including junior accessory dwelling units).
Policy HE-5.2
Section titled “Policy HE-5.2”The City will prepare amendments to the Zoning Code to allow moveable tiny houses as accessory dwelling units.
Program HE-5.2.1
Section titled “Program HE-5.2.1”The City shall amend the Zoning Code to allow moveable tiny houses as permanent accessory dwelling units that shall be subject only to those restrictions that apply to other residential dwellings of the same type in the same zone when connected to utilities, tied down and objective health, safety and design standards are met. Moveable tiny houses meeting the standards shall be allowed outside of manufactured home and special occupancy parks.
Administration: Planning Department
Funding: General Fund
Timing: As part of the City’s comprehensive updates of the General Plan and Zoning Code. Release of Public Draft: Q4 2023; with adoption targeted for 2024
Policy HE-5.3
Section titled “Policy HE-5.3”Explore ways to finance, staff, and support local community revitalization and housing rehabilitation programs, senior residents home repair, energy conservation, weatherization, and self-help preventive maintenance programs.
Program HE-5.3.1
Section titled “Program HE-5.3.1”Continue to support staff efforts to expand their housing knowledge base. Set aside funds for staff to be involved in classes, conferences, and training opportunities that will ensure that they are up to date on the latest housing and community development trends, strategies, and funding sources. Also, maintain membership and remain on mailing lists for all relevant housing-related state departments and organizations.
Administration: Finance Department, City Manager
Funding: General Fund
Timeframes: Annually, 2023-2031
Goal HE-6
Section titled “Goal HE-6”Ensure that all persons are provided a choice of housing locations within the community, regardless of race, ethnicity, color, religion, sexual orientation, natural origin, marital status, disability familial status, or other protected characteristic.
Policy HE-6.1
Section titled “Policy HE-6.1”Eliminate housing discrimination based on race, color, religion, sex, national origin, ancestry, marital status, age, household composition or size, disability, or any other arbitrary factor.
Program HE-6.1.1
Section titled “Program HE-6.1.1”
(Program HE-6.1.1 is the same program as HE-3.2.1 above)
- Continue to support the enforcement of the fair housing laws to protect against housing discrimination by providing adequate information about renters’ rights, and promote equal housing opportunity.
- The City will provide a referral service to those who handle complaints against discrimination. Such complaints are to be filed with the City Manager.
- To improve the dissemination of fair housing information, the City will make information on fair housing available to the public, through the posting of fair housing information in City Hall and in other public buildings, on the City’s website, distribution to existing apartment complexes, and publishing information and materials on the City’s website. The City will provide fair housing materials, printed and as web content, in Spanish and other languages, as requested, to reduce barriers for non-English speakers.
- The City will perform proactive public outreach using a variety of methods, e.g., community events, workshops and direct contact with developers, property owners, and tenants, to improve the dissemination of fair housing information, laws, and resources.
Accountability: City Manager
Funding: General Fund
Timing: 1) and 2) and 3) 2023-2031: materials and information about the City’s procedures for requesting reasonable accommodation from the Title 16 - Zoning, Yreka Municipal Code will be made available on the City’s website within 120 days of the effective date. 4) Commence no later than Q3 2024, and no less than annually thereafter.
Program HE-6.1.2
Section titled “Program HE-6.1.2”
The City shall review the existing procedures for requesting reasonable accommodation from Title 16 - Zoning, Yreka Municipal Code, for consistency with federal and state law, and shall prepare amendments that will codify the reasonable accommodation procedures as part of Title 16 of the Yreka Municipal Code. Specifically, the language of existing procedures shall be reviewed to ensure the reasonable accommodation procedures extend to the City’s parking regulations and providers of housing for persons with disabilities are eligible to request accommodation.
Responsibility: Planning Department
Funding: General Fund
Timing: As part of the City’s update of its comprehensive Zoning Code revision. Release of Public Draft: Q4 2023; with adoption targeted for 2024.
Program HE-6.1.3
Section titled “Program HE-6.1.3”Continue to collaborate with housing providers and community groups who represent persons with disabilities to ensure that special housing needs are addressed for seniors, large families, female-headed households, single-parent households with children, persons with disabilities and developmental disabilities, and homeless individuals and families. The City will seek to meet these special housing needs through a combination of regulatory incentives, zoning standards, new housing construction programs, and supportive services programs. The City will leverage existing available regulatory incentives provided by State law, e.g., density bonus, SB 10 (2021), supportive housing developments, accessory dwelling units, Streamlined Ministerial Approval Process (SB 35), etc. Local regulatory incentives that will be provided with adoption of Programs HE-1.2.1, HE-1.3.1, HE-1.3.1, HE-1.3.3, HE-2.1.1, HE-2.1.2, etc. as discussed above, will also be leveraged once local regulations are adopted. In addition, the City may seek funding under the federal Housing Opportunities for Persons with AIDS, California Child Care Facilities Finance Program, and other state and federal programs designated specifically for special needs groups such as seniors, persons with disabilities, and persons at risk for homelessness. (Formerly Program HE.2.1.7)
Responsibility: City Manager, Planning Department
Funding: General Fund and Grant Funding
Timing: City staff will meet with housing providers and community groups no less than annually, from 2023 to 2031. The City will apply for funding annually from 2023-2031.
Program HE-6.1.4
Section titled “Program HE-6.1.4”The City will amend Title 16 - Zoning, Yreka Municipal Code to remove the distinction between small and large group homes in the Medium Density Residential (R-2), High Density Residential (R-3), Commercial Downtown (C-2), and Commercial Highway (CH) zones and permit group care facilities as a by-right use in these zones.
Responsibility: Planning Department
Funding: General Fund
Timing: As part of the City’s update of its comprehensive Zoning Code revision. Release of Public Draft: Q4 2023; with adoption targeted for 2024.
Program HE-6.1.5
Section titled “Program HE-6.1.5”During the planning period, the City shall monitor State law for amendments to employee and farmworker housing law to ensure ongoing compliance with State law. If State law is amended such that revisions to the City of Yreka’s Zoning Code are necessary for legal compliance, the City will initiate amendments to Title 16 of the Yreka Municipal Code.
Responsibility: Planning Department
Funding: General Fund
Timing: As part of the City’s update of its comprehensive Zoning Code revision. Release of Public Draft: Q4 2023; with adoption targeted for 2024. Thereafter, the City will monitor State law annually for amendments.
Program HE-6.1.6
Section titled “Program HE-6.1.6”
The City shall update the definition of ‘family’, Section 16.12.480 of Title 16 - Zoning, Yreka Municipal Code, to be compliant with State law, and to expressly remove references or requirements that subject a family to having a common bond by means of blood, marriage, or conscientiously established relations. Additionally, group homes shall not be excluded for utilizing the definition of family.
Responsibility: Planning Department
Funding: General Fund
Timing: As part of the City’s update of its comprehensive Zoning Code revision. Release of Public Draft: Q4 2023; with adoption targeted for 2024.
Goal HE-7
Section titled “Goal HE-7”Development of sites for special needs housing, including the housing needs of persons with disabilities and persons experiencing homelessness to reduce and prevent occurrences of homelessness. Also types of housing opportunities that enable residents to age in place and provide for intergenerational housing.
Policy HE-7.1
Section titled “Policy HE-7.1”The City shall amend Title 16, Yreka Municipal Code, to ensure consistency with State law, specifically Government Code Sections 65583(a)(4) et seq, 65650-65656 and 65660-65668, for supportive housing developments, low barrier navigation centers, and emergency shelters. The amendments shall permit supportive housing developments and low barrier navigation centers in zones that permit multifamily and mixed uses including nonresidential zones permitting multifamily uses as by-right development when the statutory requirements are met.
Program HE-7.1.1
Section titled “Program HE-7.1.1”
- Consistent with Government Code Section 65650 et seq., the City shall amend the R-2, R-3, RPO, CPO, C-2 CH and CT zones to allow by-right supportive housing developments as a by-right use if the requirements of Government Code Sections 65651 and 65652 are met.
- Consistent with Government Code Section 65660 et seq., the City shall amend the R-2, R-3, RPO, CPO, C-2 CH and CT zones to allow by-right low barrier navigation centers as a by-right use if the requirements of Government Code Section 65662.
- The City shall amend the definition of supportive housing, and specifically the definition of ‘target population’, contained in Yreka Municipal Code Section 16.12.773 to reference the definition of target population contained Government Code Section 65582(i).
- Pursuant to AB 2162 (2018), the City will amend Section 16.46.160 of the Zoning Code to meet the requirement that management standards are objective and encourage and facilitate the development of, or conversion to, emergency shelters, and are consistent with Government Code Section 65583(a)(4) et seq. The City shall also amend the definition of emergency shelter, Section 16.12.443 of the Zoning Code, to include other interim housing interventions, including, but not limited to, a navigation center, bridge housing, and respite or recuperative care consistent with Government Code Section 65583(a) (C).
- The City shall review the existing adopted parking standards for emergency shelters and determine if the standard is objective, provides sufficient parking to accommodate the staff working in emergency shelters, and does not require more parking for emergency shelters than other residential or commercial uses within the same zone, consistent with
AB 139 (2019). If the City finds the adopted parking standards for emergency shelters do not meet the requirements of AB 139, then the City shall prepare amendments to Title 16.
Administration: Planning Department
Funding: General Fund
Timing: As part of the City’s comprehensive updates of the General Plan and Zoning Code. Release of Public Draft: Q4 2023; with adoption targeted for 2024.
Policy HE-7.2
Section titled “Policy HE-7.2”The City will amend the Zoning Code to allow small and large group homes as a by-right use in more zoning districts and subject to objective performance and objective design standards, and in the same manner as other residential development in the same zone. These amendments will remove regulatory barriers and allow for the development of a range of group and assisted care housing for individuals with disabilities by ensuring appropriate zoning for all ranges of housing from group housing, independent living with services on-site, and institutional care facilities. The City shall allow group care facilities in all residential zones including single-family zones in compliance with Affirmatively Further Fair Housing and applicable Health and Safety Code Sections.
Program HE-7.2.1
Section titled “Program HE-7.2.1”
The City shall amend Title 16 - Zoning, Yreka Municipal Code for the following and in preparing the amendments, the City may consult the Department of Housing and Community Development (HCD) Group Home Technical Advisory published December 2022.
- Amend Yreka Municipal Code Section 16.12.550 - ‘Group care home - large’ and Section 16.12.552 - ‘Group care home’ - small consistent with state law including Government Code Sections 8899.50 and 65583.
- Group homes, even homes that have more than six residents, that do not provide licensable services shall be allowed in R-A, R-1, R-2, R-3, and RPO zones, subject only to the generally applicable, nondiscriminatory health, safety, and zoning laws that apply to other residential development within the same zone.
- Group homes that provide licensable services to six or fewer residents shall be allowed in R-A, R-1, R-2, R-3, C-2, and CH zones, subject only to the generally applicable, nondiscriminatory health, safety, and zoning laws that apply to residential development within the same zone.
- Groups homes that provide licensable services to more than six residents as a by-right use in the Medium Density Residential (R-2), High Density Residential (R-3), Commercial Downtown (C-2), and Commercial Highway (CH) zones. Development, performance, and design standards shall be objective, nondiscriminatory health, safety, and zoning laws that apply to other residential development within the same zone.
- Group homes that provide licensable services to more than six residents shall be subject to conditional use permit in the Single-Family Residential (R-1) and Residential Agriculture (R-A) zones, and the conditional use permit findings shall be objective and provide for approval certainty.
Administration: Planning and Building Department
Funding: General Fund
Timing: As part of the City’s update of its General Plan. Release of Public Draft: Q4 2023; with adoption targeted for 2024.
Policy HE-7.3
Section titled “Policy HE-7.3”The City will remove regulatory barriers to encourage conversion or development of single-room occupancy (SRO) units in C-2, CH, and CT zones by permitting by-right SROs by-right when objective performance standards for proximity to services are demonstrated.
Program HE-7.3.1
Section titled “Program HE-7.3.1”The City shall prepare amendments that would allow by-right SRO development in C-2, CH, and CT zones when located within a distance a person can reasonably walk to services (e.g., a quarter mile), and that meets other applicable zoning requirements for SROs. SROs proposed to be located at a greater walking distance shall be subject to a use permit. All development and performance standards shall be objective.
Administration: Planning and Building Department
Funding: General Fund
Timing: As part of the City’s update of its General Plan. Release of Public Draft: Q4 2023; with adoption targeted for 2024.
Policy HE-7.4
Section titled “Policy HE-7.4”As feasible, the City will support the work of housing providers to address the housing needs of special needs groups (seniors, female headed households, persons with disabilities, persons with developmental disabilities, farmworkers, individuals experiencing homelessness, and persons with extremely low incomes) and will seek to assist in meeting these special housing needs through a combination of regulatory incentives (including those presented in Programs HE-2.1.1, 2.1.2, 2.1.3 and 2.1.6), zoning standards, new housing construction programs, and supportive services programs.
Program HE-7.4.1
Section titled “Program HE-7.4.1”- The City will actively support the implementation of the Siskiyou County 10 Year Plan to End Homelessness, specifically goals for increasing the supply of permanent supportive housing and affordable housing, expanding the capacity for housing providers, and expanding options for low barrier emergency shelter and housing. The City will consult with the NorCal Continuum of Care on strategies to provide services, shelter, and housing for those experiencing homelessness in the City.
- The City shall coordinate and work with Karuk Tribe Housing Authority, Siskiyou County, the NorCal continuum of care, existing nonprofit housing organizations, and partner agencies to develop strategies that address homelessness through a shared vision, coordinated programs, and joint funding opportunities, including identifying and securing funding sources to develop vacant properties and to rehabilitate and convert nonresidential buildings to housing for extremely low income households and special needs households.
- The City will continue to support the efforts of the housing authorities in administering the Housing Choice Voucher program. (See Program 5.1 for more details).
- The City will meet with representatives from the Housing Authorities, the NorCal continuum of care, and other nonprofit organizations to provide information on potential sites and housing development proposals that would be appropriate for the use of housing vouchers in conjunction with state or federal new construction or rehabilitation subsidies.
Administration: Planning Department, City Manager
Funding: General Fund
Timing: Coordination will occur at least annually from 2023 to 2031; the City will apply for funding annually.
Program HE-7.4.2
Section titled “Program HE-7.4.2”The City will explore and consider declaring a shelter crisis pursuant to Government Code Section 8698 et seq. and whether the provisions would improve the City’s ability to assist persons experiencing homelessness. Pursuant to Government Code Section 8698(d), a declaration of a shelter crisis ‘means the duly proclaimed existence of a situation in which a significant number of persons are without the ability to obtain shelter, resulting in a threat to their health and safety.’ Some of the benefits of declaring a shelter crisis may include:
- City immunity from liability for ordinary negligence in the provision of emergency housing provisions of any state or local regulatory statute, regulation, or ordinance prescribing standards of housing, health, or safety are suspended to the extent that strict compliance would in any way prevent, hinder, or delay the mitigation of the effects of the shelter crisis. A city may, in place of such standards, enact municipal health and safety standards to be operative during the housing emergency consistent with ensuring minimal public health and safety.
However, a shelter crisis declaration would new add new responsibilities to the City:
- Annual reporting to the State
- The obligation to develop a plan to address the shelter crisis, including, but not limited to, the development of homeless shelters and permanent supportive housing, as well as onsite supportive services. The plan must also address transitioning residents from homeless shelters to permanent housing. The plan must be developed and made available to the public by July 1 of the year following the shelter crisis declaration.
Another consideration is that the provisions of Government Code Section 8698 et seq. extend only to public facilities, meaning constructed and operating on City-owned or City-leased land which may be a limiting factor.
Administration: Planning Department, City Manager
Funding: General Fund
Timing: Within 12 months of adoption of the Housing Element
Program HE-7.4.3
Section titled “Program HE-7.4.3”The City will consider amending the Yreka Municipal Code to allow for the by-right conversion of existing motels and hotels to dwellings configured as multifamily and single room occupancy units that are available for rent, ownership, or mixed tenure.
Administration: Planning Department
Funding: General Fund
Timing: As part of the City’s update of its General Plan. Release of Public Draft: Q4 2023; with adoption targeted for 2024.
Table 2-1 City of Yreka Housing Element Quantified Objectives, 2023-2031
Section titled “Table 2-1 City of Yreka Housing Element Quantified Objectives, 2023-2031”| Housing Type | Extremely Low Income | Very Low | Low | Moderate | Above Moderate | Total |
|---|---|---|---|---|---|---|
| New Construction | 20 | 20 | 50 | 150 | 100 | 340 |
| Rehabilitation | 1 | 1 | 2 | 1 | 2 | 7 |
| Preservation | 5 | 10 | 35 | 10 | 0 | 60 |
| Housing Choice Vouchers | 60 | 20 | 20 | 0 | 0 | 100 |
| Totals | 86 | 51 | 107 | 161 | 102 | 507 |
Chapter 03 - Analysis of Previous Housing Element
Section titled “Chapter 03 - Analysis of Previous Housing Element”An important aspect of the Housing Element is an evaluation of achievements under the implementation programs included in the previously adopted Housing Element. The evaluation provides valuable information on the extent to which programs have been successful in achieving stated objectives and addressing local needs and to which these programs continue to be relevant in addressing current and future housing needs in Yreka. The evaluation also provides the basis for recommended modifications to programs and the establishment of new objectives in the Housing Element. While many of the City’s former programs were continued or modified in this update, some were removed due to being successfully implemented and others were added to respond to changes in state law and local conditions.
2014 - 2019 HOUSING PROGRAMS
Section titled “2014 - 2019 HOUSING PROGRAMS”Of the twenty-one programs included in the prior Housing Element, fifteen are being continued and/or will be modified to provide more effective programs for the current cycle and ensure consistency with State law. The table below provides a summary of each program, its progress, and status for the current update.
Table 3-1 2014-2019 Housing Programs Progress
Section titled “Table 3-1 2014-2019 Housing Programs Progress”| Program | Progress/Effectiveness | Applicability to 2023–2031 Housing Element |
|---|---|---|
| Program HE.1.1.1: Every year, as part of the annual Housing Element review, the Planning Commission will review the City’s vacant land inventory with the objective of ensuring that Yreka can accommodate a variety of housing types. If a deficiency is found, steps shall be taken to change the General Plan and zoning as needed to increase the amount of available land. The inventory will be made available to the public, especially the development community, for their information and use. City staff will also update the Planning Commission on the City’s current fee schedule to ensure that the City’s fees are not adding an additional constraint to the development of housing. In order to increase public input and support of the City’s housing programs, the City will encourage the participation of groups interested in housing in the annual Planning Commission review of the Housing Element. This will occur through public notice and normal contact and solicitation of participation with local agencies and interest groups. Responsibility: Planning Department Financing: General Fund Timing: Annually |
Progress: The City continues to maintain a list of the available vacant land in the city that is appropriate to meet its share of regional housing needs. Additionally, in 2020, the City received SB2 grant funding to identify and inventory developable land, vacant land and underutilized land in the city. This is currently in progress and will assist in the production of affordable housing in the city. Effectiveness: City staff report on the Housing Element progress on an annual basis to the Planning Commission; this includes an update on the land inventory. The City gets very few development requests annually and has received limited input from local housing agencies or interest groups. |
Continue and modify as per Programs HE-1.1.1 and HE-1.1.2. Program HE-1.1.1 obligates the City to implement No Net Loss on a project by project basis. Program HE-1.1.2 calls on the City to annually review the vacant land inventory to ensure adequacy of sites suitable for a variety of residential development. |
Program HE.1.2.1: Upon discussions with developers and submittal of residential development plans (included but not limited to developers of large residential subdivisions i.e., 50 or more units), the City will encourage and support those plans which include lower-income housing in areas appropriate to the needs and desires of the population it would house and at the same time be convenient to public services. “Encourage and support” as used herein means:
Financing: General Fund Timing: Continuous, as projects are processed through the Public Works Department and as staff meet with developers looking to build in Yreka |
Progress: The City received one application for the construction of 50 lower income housing units in the planning period (Siskiyou Crossroads, 2021). The City actively promotes the construction of new housing and will process all housing applications. Additionally, in 2020 the City received LEAP grant funding to re-zone property owned by Siskiyou County to High Density Residential (HDR). This will assist in the production of affordable housing in the city. Effectiveness: Due to lack of application/permit activity, there have been limited opportunities to implement this program. |
Continue and modify. Program HE-2.1.3.3 commits the City to launch a marketing campaign to attract property owners and developers to improved housing production. |
| Program HE.1.2.2: The City will amend the Zoning Ordinance to state that the City allows density bonuses in accordance with the requirements of state density bonus law (Government Code Section 65915). The City will also amend the definition of density bonus to comply with the Government Code requirements. Responsibility: City Council, Planning Department Financing: General Fund Timing: Within one year of Housing Element adoption |
Progress: The Zoning Ordinance was revised in May 2014 in accordance with state density bonus law. Effectiveness: This program was implemented. |
Relaunch. State Density Bonus Law (SDBL) has received additional amendments. Program HE-2.1.3 directs the City to review current SDBL and update the City’s local ordinance accordingly. |
Program HE.1.2.3: The City will continue efforts to mitigate the potential loss of extremely low-, very low-, and low-income housing units through the conversion of subsidized rental housing projects to market-rate housing through the following actions:
Financing: California Housing Finance Agency Preservation (Help Program), Acquisition Financing Mortgage Insurance for Purchase/Refinance (HUD), Multifamily Housing Program, CalHFA (preservation acquisition financing). Timing: Contact property owners of Shadows Garden Apartments during the second half of 2014 to determine future ownership plans; implement preservation strategy if owners indicate desire to sell or convert their properties. |
Progress: The Shadow Gardens property owner has been in contact with the City and continues to provide affordable housing through HUD section 8 vouchers. Effectiveness: This program appears effective: the Shadows Garden Apartments continues to participate in the HUD section 8 program. |
Modify and continue. HUD’s project-based rental assistance subsidies for 29 units of the Deer Creek Apartments development will be expiring in 2023. Program HE-4.2.1 commits the City to taking actions to prevent the conversion of these apartments to market rate units. |
| Program HE.1.3.1: Continue to review the effectiveness of the Zoning Ordinance and make revisions if it is found the ordinance is creating unusual constraints on affordability and housing availability. This will include a review of the conditional use permit process on multifamily applications to determine whether the process is a deterrent to construction of affordable multifamily housing. During the annual report to the Planning Commission, an assessment shall be made of multifamily projects considered during the year. If it is determined that requiring the conditional use permit process is in fact acting as a deterrent to providing affordable housing, the City will reconsider its position on this matter and take the steps necessary to remove any constraints the process may be causing. Responsibility: Planning Department, Planning Commission Financing: General Fund Timing: Annually |
Progress: No multifamily units have been proposed in the City that required a CUP since the development of this program (the Siskiyou Crossroads 50-unit multifamily project did not require a CUP in compliance with AB-2162). Additionally, in 2020, the City received SB2 grant funding to develop Objective Design Standards for qualifying multifamily developments. This will assist in the production of affordable housing in the city. Effectiveness: City has received limited proposals for projects of this type and have not heard it is a constraint, but additional permitting is more costly and time consuming. The City continues to review Zoning Ordinance effectiveness and will be preparing multifamily design standards to facilitate and streamline affordable housing project review. |
Modify. Program HE-1.2.1 directs the City to amend the Zoning Code to allow multifamily housing development with dwelling groups of five or more units by-right, removing the conditional use permit requirement for this housing configuration. Additionally, amend the Zoning Code as needed such that multifamily housing development is subject only to standards that are objective. |
| Program HE.1.4.1: Maintain residential zoning districts and development standards that encourage the development of single-family housing products that are affordable to first-time homebuyers, and when feasible, participate in the HOME Program as Notices for Funding Available (NOFAs) are released. Responsibility: City Manager Financing: General Fund Timing: Ongoing; apply for HOME funds as NOFAs are released |
Progress: Currently, the City does not have a First-Time Homebuyers Program. This is primarily due to the lack of interest shown for this type of program by the public and limited staff capacity. The City continues to evaluate the HOME program and monitor First-Time Homebuyer demand to establish future need and availability. Effectiveness: The City reviews all NOFAs, however there is limited staff to evaluate when funding is applicable and to be able to apply for and implement programs. |
Continue |
Program HE.2.1.1: Review the Reasonable Accommodation procedure and make revisions to provide exceptions in zoning and land use for housing for persons with disabilities. This procedure will be a ministerial process, with a minimal processing fee, subject to approval by the City Manager or his designee applying the following decision-making criteria:
Financing: General Fund Timing: Within one year of Housing Element adoption |
Progress: The City adopted a reasonable accommodations procedure that includes an express permit program, free building inspections, and special response to accessibility complaints that may be necessary to ensure persons with disabilities have equal access to housing. Effectiveness: This program was implemented; to date the City has not received a reasonable accommodation request using the adopted procedures, however. |
Relaunch. Program HE-6.1.2 obligates the City to review the existing procedure for consistency with federal and state law, prepare amendments to codify the procedures as part of the Yreka Municipal Code. |
| Program HE.2.1.2: In order to facilitate housing for extremely low-income persons, the City will amend the Zoning Ordinance to clarify the definition of single-room occupancy units (SROs), as well as describe specific development standards for these units. SROs will be allowed with a conditional use permit in the C-2 and CH zones. Responsibility: City Manager, Planning Department Financing: General Fund Timing: Within one year of Housing Element adoption |
Progress: The Zoning Ordinance was revised in May 2014 to include this. Effectiveness: This program was implemented. There have not been any inquiries about SROs, however. |
Modify. Program HE-7.3.1 commits the City to amending Title 16 of the Yreka Municipal Code to allow by-right SRO development in C-2, CH, and CT zones when in proximity to services (e.g., a quarter mile), and that meets other applicable zoning requirements for SROs. |
Program HE.2.1.3: Pursuant to SB 2 (2007), the City will amend the Zoning Ordinance to include a separate definition of “emergency shelters” consistent with Section 50801 of the California Health and Safety Code. Further, the City will amend the Zoning Ordinance to allow emergency shelters of 15 beds or fewer by right in the Light Industrial (M1) zone. The Light Industrial zone has sufficient capacity with 50 vacant parcels totaling approximately 460 acres with adjacent sewer and water infrastructure, which is sufficient capacity to address Yreka’s shelter needs for those experiencing homelessness. In addition, the City will evaluate adopting objective development and managerial standards that are consistent with Government Code Section 65583(a)(4). Standards that jurisdictions may apply to emergency shelters are limited by state law. Emergency shelter standards may include:
Financing: General Fund Timing: Amendments to the Zoning Ordinance will be made one year from the adoption of the 6th cycle Housing Element |
Progress: The Zoning Ordinance was revised in May 2014 to include portions of this program related to definitions. Effectiveness: The City has not yet adopted development and managerial standards and will continue to evaluate the need for these. |
Modify and continue. Programs HE-7.1.1.4 and HE-7.1.1.5 call on the City to update the Zoning Code to clarify and ensure all development and performance standards are objective. Also, amendments to the parking regulations to ensure consistency with AB 139 (2019) for emergency shelter parking requirements. |
| Program HE.2.1.4: Pursuant to SB 2 (2007), the City will amend the Zoning Ordinance to include separate definitions of “supportive housing” and “transitional housing” consistent with Sections 50675.14 and 50675.2 of the California Health and Safety Code. The City will also amend the Zoning Ordinance to allow transitional and supportive housing as a residential use subject only to those restrictions that apply to other residential uses of the same type in the same zone without undue special regulatory requirements. Responsibility: City Manager, Planning Department, Planning Commission Financing: General Fund Timing: Amend Zoning Ordinance within one year of Housing Element adoption |
Progress: The Zoning Ordinance was revised in May 2014 to include this. Effectiveness: This program has been completed. However, the Government Code has been amended with specific mandates for jurisdictions to allow by-right qualifying supportive housing developments. |
Completed. However, the Yreka Municipal Code’s definition of target population cross references a section of the California Health and Safety Code that has sunset. Program HE-7.1.1.3 directs the City to amend the Yreka Municipal Code to reference the definition readily located in Government Code Section 65582(i). Additionally, further legislation has been enacted to allow by-right qualifying supportive housing developments. Program HE-7.1.1 obligates the City to amend the Yreka Municipal Code to incorporate these amendments. |
| Program HE.2.1.5: In order to help meet the needs of extremely low-income households, the City will prioritize funding and/or offer financial incentives or regulatory concessions to encourage the development of single-room occupancy units or other units affordable to households with extremely low income. Further, the City will contact qualified developers of low income housing to discuss existing extremely low income housing needs in the City, as well as possible incentives for development of housing. Objective: Facilitate the development of single room occupancy units or other units deemed affordable to those with extremely low incomes. Responsibility: City Manager, Planning Department, Planning Commission, City Council Financing: Grant funding Timing: Meet with housing developers at least twice during the planning period, with incentives ongoing as housing for those with extremely low income is proposed. |
Progress: The City is open to any type of housing development. The City has researched the area for nonprofit housing developers, however, the City has not found any that are considering the development of SROs in Yreka at this time. The City will continue to monitor this situation and pursue development of units affordable to extremely low income households. Effectiveness: Due to lack of application/permit activity, there have been limited opportunities to implement this program. |
Continue |
| Program HE.2.1.6: Work with housing providers to ensure that special housing needs are addressed for seniors, large families, female-headed households, single-parent households with children, persons with disabilities and developmental disabilities, and homeless individuals and families. The City will seek to meet these special housing needs through a combination of regulatory incentives, zoning standards, new housing construction programs, and supportive services programs. In addition, the City may seek funding under the federal Housing Opportunities for Persons with AIDS, California Child Care Facilities Finance Program, and other state and federal programs designated specifically for special needs groups such as seniors, persons with disabilities, and persons at risk for homelessness. Objective: Work with housing providers by meeting at least twice during the planning period to discuss special housing needs. Assist, when feasible with funding applications. Responsibility: City Manager, Planning Department Financing: Grant funding Timing: The City will begin researching funding opportunities this year and will meet with housing providers annually beginning in 2015. |
Progress: The City is open to any type of housing development. In 2021 the City approved the Siskiyou Crossroads 50-unit mixed affordable and supportive multifamily housing project proposed by Rural Communities Housing Development Corporation. Effectiveness: The City has researched area for nonprofit housing developers and will continue to identify housing providers and opportunities. |
Continue |
| Program HE.2.1.7: Continue to allow group care facilities for six or fewer persons in all residential zones including single-family zones in compliance with Health and Safety Code Sections 1267.8, 1566.3, and 1568.08. Amend the Zoning Ordinance to allow group care facilities for more than six persons by conditional use permit in the Medium Density Residential (R-2), High Density Residential (R-3), Commercial Downtown (C-2), and Commercial Highway (CH) zones. This will allow for the development of a range of assisted care housing for adults who have limited self-care abilities by ensuring appropriate zoning for all ranges of housing from group housing to independent living with services on-site for institutional care facilities. Also to ensure compliance with Health and Safety Code Sections 1267.8, 1566.3, and 1568.08, the amendment will clarify the definitions of “group residential” and “group care facility.” The definition of group care facility must distinguish between facilities for six or fewer persons and for larger facilities for more than six persons. Facilities for six and fewer persons must not be treated differently than other by-right single-family housing uses and may not be required to obtain conditional use permits or variances that are not required of other family dwellings. Responsibility: Planning Department, Planning Commission Financing: General Fund Timing: 2014–2015 |
Progress: The Zoning Ordinance was revised in May 2014 to include this. Effectiveness: This program has been implemented, however modifications are proposed to make it more effective. |
Modify. Program HE-7.2.1 directs the City to amend Zoning Code to not differentiate between small and large group care facilities in the R-2, R-3, C-2, and CH zones, and allow by-right when objective performance and design standards are met. |
| Program HE.2.1.8: To comply with the state Employee Housing Act (Health and Safety Code Sections 17021.5 and 17021.6), the City will amend the Zoning Ordinance to treat employee housing that serves six or fewer persons as a single-family structure and permitted in the same manner as other single-family structures of the same type in the same zone (Section 17021.5) in all zones allowing single-family residential uses. The Zoning Ordinance will also be amended to treat employee housing consisting of no more than 12 units or 36 beds as an agricultural use and permitted in the same manner as other agricultural uses in the same zone (Section 17021.6) in all zones allowing agricultural uses. Responsibility: Planning Department, Planning Commission Financing: General Fund Timing: 2014–2015 |
Progress: The Zoning Ordinance was revised in May 2014 to include this. Effectiveness: This program has been completed. However, Section 17021.8 the Employee Housing Act was amended in 2020. |
Relaunch. Program HE-2.1.4 calls on the City to amend the Zoning Code to allow small and large employee housing by-right CPO, C-2, CH, and CT zones when located within reasonable walking to services, and when objective development, performance, and design standards are met. |
| Program HE.3.1.1: When feasible, the City will continue to provide loans to homeowners in existing owner-occupied residences, using state and federal subsidies, for the rehabilitation of their property or for the removal and replacement of dilapidated units. Responsibility: City Manager, Finance Department, Building Department Financing: CDBG, CHFA, HOME, low interest home equity loans offered by the City. Timing: 2014–2019 |
Progress: The City does not currently have a housing rehabilitation program. The past rehabilitation program was discontinued due to a lack of participation and limited staff capacity and knowledge about managing the programs. The City is looking into what the needs are moving forward and what funding is available. Effectiveness: This program will be modified and continued. |
Modify and continue per Program HE-4.3.1.2. |
| Program HE.3.1.2: Continue to encourage rehabilitation of historic residential structures within the city through Mills Act contracts or other programs, as well as assist in application procedures for the inclusion of structures on the historic register. Responsibility: Planning Department Financing: General Fund Timing: Ongoing, as applications for rehabilitation or for inclusion of structures in the historic register come in |
Progress: The City is unaware of any Mills Act contracts in the City. No applications for the inclusion of historic residential structures on the historic register were submitted in the planning period (2014–2019). Effectiveness: Although no applications were received, the City will continue to encourage rehabilitation of historic residential structures. |
Continue and modify to allow for internal conversions for multiple units and continue. |
| Program HE.3.1.3: Utilize the code enforcement program as a means of keeping track of the condition of the city’s housing stock. This, along with periodic review by the Planning Commission and the City Council of residential areas needing improvements, could identify needed code enforcement, necessary improvements to city infrastructure, and/or the opportunity to obtain financing for improvements. As feasible, the City will continue to prioritize code enforcement and provide adequate funding and staffing to support code enforcement programs. Responsibility: City Manager, Building Department, Planning Department Financing: General Fund Timing: Ongoing |
Progress: As the City becomes aware of issues needing attention, they are addressed. The City has taken action on violations related to health and safety issues on a case-by-case complaint basis. Effectiveness: The City has limited funding and staffing for code enforcement and it is largely complaint driven; issues are addressed on a case-by-case basis. |
Continue (see Program HE-4.3.2). |
| Program HE.4.1.1: Continue to support the enforcement of the fair housing laws to protect against housing discrimination by providing adequate information about renters’ rights, and promote equal housing opportunity. The City will make information on fair housing available to the public, through the posting of fair housing information in City Hall and in other public buildings, and providing to existing apartment complexes. The City will provide a referral service to those who handle complaints against discrimination. Such complaints are to be filed with the City Manager. Responsibility: City Manager Financing: General Fund Timing: Ongoing |
Progress: Posters from the California Department of Fair Employment and Housing have been posted at City Hall to assist those with discrimination complaints. As complaints are received, individuals are directed to the appropriate agency. Although there have been no formal complaints filed with the City, the City is periodically contacted about renter and tenants’ rights and provides information as applicable. Effectiveness: This program appears effective as residents contact the City with questions. |
Continue |
| Program HE.5.1.1: Continue to support staff efforts to expand on their housing knowledge base. Set aside funds for staff to be involved in classes, conferences, and training opportunities that will ensure that they are up to date on the latest housing and community development trends, strategies, and funding sources. Also, maintain membership and remain on mailing lists for all relevant housing-related state departments and organizations. Responsibility: Finance Department, City Manager Financing: General Fund Timing: Annually, Ongoing |
Progress: The City provides funding for staff to attend conferences and training sessions as needed. City staff are on mailing lists with relevant housing-related state departments and organizations. There is no specific budget set aside for training. Effectiveness: City staff attend trainings and conferences as feasible and remain on mailing lists to stay up to date on housing related matters. |
Continue |
| Program HE.6.1.1: Promote the use of energy conservation measures in all housing through the use of public and private weatherization programs. Continue to provide information on currently available weatherization and energy conservation programs to residents of the city. The City has information available for the public at the front counter of City Hall and will distribute information through electronic and hard-copy mailings. Responsibility: Planning Department, Building Department Financing: Private and government funds Timing: Annually in newsletter and ongoing |
Progress: The City has instituted a citywide newsletter to disseminate information on energy conservation programs. Although this one local weatherization program has been discontinued, the City wants to keep and/or find a replacement program. Additionally, the County air pollution control district has an existing program for reduced-cost, efficient wood burning stoves and provides low cost vouchers for wood (with funding every couple years). Effectiveness: This program has been well used and effective. |
Continue |
| Program HE.6.1.2: Continue to enforce state requirements, including Title 24 of the California Code of Regulations, for energy conservation in new residential projects, and encourage residential developers to employ additional energy conservation measures for the siting of buildings, landscaping, and solar access through development standards contained in the Zoning Ordinance, Building Code, and Specific Plans as appropriate. Responsibility: Planning Department, Building Department Financing: General Fund Timing: Ongoing |
Progress: The City requires compliance with the Zoning Ordinance and California Building Code, including Title 24, to ensure energy conservation in new residential projects. Effectiveness: All new units must comply with Title 24. |
Continue as required by State law. |
| Overall effectiveness of the 5th cycle’s goals, policies, and related actions in meeting the housing needs of special needs populations (e.g., elderly, persons with disabilities, large households, female-headed households, farmworkers, and persons experiencing homelessness). | For the duration of the 5th cycle the City did not have the staff or other resources available to implement programs that target the housing needs of special needs populations. In 2021, the City facilitated the development of Siskiyou Crossroads on property owned by Siskiyou County, with a regional nonprofit housing provider serving as the developer and property manager. Siskiyou Crossroads is a 50-unit multifamily development consisting of a mix of supportive housing and general low-income population, with no market rate units. | For the 2023-2031 Housing Element, the City is committing general fund revenues to help fund the implementation of Housing Element programs including programs that address the housing of special needs populations. |
APPENDIX A - HOUSING NEEDS ASSESSMENT
Section titled “APPENDIX A - HOUSING NEEDS ASSESSMENT”1. INTRODUCTION
Section titled “1. INTRODUCTION”The Housing Needs Assessment provides a demographic profile of the city by analyzing the following types of information: population trends, household income and poverty, special housing needs, housing characteristics, costs and conditions, constraints to development, and resources and opportunities. Government Code Section 65583(a) requires an assessment of housing needs and an inventory of resources and constraints relevant to the meeting of these needs.
The California Department of Housing and Community Development (HCD) developed a data packet for jurisdictions in Siskiyou County that contains much of the information required for the Housing Needs Assessment of this Housing Element and is the primary source of data for this document. Where additional information is required, the US Census, which is completed every ten years, is the preferred data source, as it provides the most reliable and in-depth data for demographic characteristics of a locality. This report uses the 2020 US Census and the 2019 5-Year American Community Survey (ACS) for current information and the 2010 US Census to track changes since the year 2010. The California Department of Finance (DOF) is another source of valuable data that is more current than the Census. However, the DOF does not provide the depth of information that can be found in the 2020 US Census. Whenever possible, the Siskiyou County data packet, DOF data, and other local sources were used in the Housing Needs Assessment in order to provide the most current profile of the community.
The 2020 US Census did not collect information in several categories that are required for the Housing Needs Assessment. Where this is the case, historical DOF or ACS data is used. Where DOF data is not available, information from the 2010 US Census is retained. In cases where this is not feasible or useful, this assessment references US Census Bureau American Community Survey (ACS) data. The ACS provides estimates of numerous housing-related indictors based on samples averaged over a five-year period. Where the US Census provides complete counts of various demographic indicators, the ACS provides estimates based on statistically significant samples. Due to the small size of the sample taken in Yreka, the estimates reported by the ACS have large margins of error. Where ACS data is used, the numbers should not be interpreted as absolute fact, but rather as a tool to illustrate general proportion or scale. The data presented in the Housing Needs Assessment will not only guide the development of housing goals and policies but will also be integrated into the body of the Housing Element to present the current status of housing and housing-related issues in Yreka. Definitions of the various US Census Bureau terms that are used throughout this document have been included in Appendix C for clarification.
The Housing Needs Assessment is organized into three main sections. The first section focuses on demographic information, such as population trends, ethnicity, age, household composition, income, employment, housing characteristics, general housing needs by income, and housing needs for special segments of the population. This first section outlines the characteristics of the community and identifies those characteristics that may have significant impacts on housing needs in the community.
The second section identifies possible governmental and non-governmental constraints to housing development in Yreka. The City has planning, zoning, and building standards that guide and affect residential development patterns and influence housing availability and affordability. Environmental and housing market conditions also affect the location, availability, affordability, and type of housing that is constructed. The ‘non-governmental’ influences include such factors as the availability and cost of financing, land, and materials for building homes; natural conditions that affect the cost of preparing and developing land for housing; and the business decisions of individuals and organizations in home building, finance, real estate, and rental housing that impact housing cost and availability.
The third section identifies the resources and opportunities for affordable housing in the city, which includes an inventory of adequate sites for affordable housing, funding resources, and a description of the current housing programs that work to provide affordable housing to the residents of Yreka.
2. SUMMARY OF FINDINGS
Section titled “2. SUMMARY OF FINDINGS”2.1. POPULATION AND HOUSEHOLD CHARACTERISTICS
Section titled “2.1. POPULATION AND HOUSEHOLD CHARACTERISTICS”Yreka’s population increased by less than one percent between 2010 and 2020 (2020 US Census, 2010 US Census). The city is expected to grow at a slow rate for the duration of the current planning period. According to the 2020 US Census, Caucasians comprise the majority of the city’s residents (72 percent), followed by Hispanic or Latino (12 percent) and American Indian (9 percent).
According to the 2010 US Census and 2015-2019 ACS Five-Year Estimates, the city’s median income for homeowners increased by approximately 11 percent between 2010 and 2019. Income for renter-occupied households increased much higher at 35% which was a large jump from 2000 to 2010 (no change). In 2019, more than half of households had incomes below the low-income ceiling (38 percent) (2015-2019 ACS Five-Year Estimates; HCD 2020). As of December 2021, the unemployment rate was 5.6 percent, which is lower than Siskiyou County’s rate (6.4 percent) but higher than the state’s overall rate (5.0 percent) (California Employment Development Department 2021).
2.2. SPECIAL NEEDS HOUSING
Section titled “2.2. SPECIAL NEEDS HOUSING”Between 2010 and 2019, the 65-74 age group experienced an 18% growth, while those 75 and older decreased by almost 18% resulting in net senior population increase of about 1% (2010 US Census, 2019 ACS). As of 2019, the majority of seniors in Yreka own their homes (71 % ). Most people living with a disability in the city have a sensory disability (54%). Female-headed households make up 10 percent of all households. Ownership rates appear to have increased since 2010 for larger families, which have an ownership rate of 54 % , up from 38 % (2010 US Census, 2019 ACS).
2.3. HOUSING CHARACTERISTICS
Section titled “2.3. HOUSING CHARACTERISTICS”The city’s housing stock is mostly single-family and owner-occupied. According to the City’s building permit database, 41 single-family units were built between 20 15 and 2021 (an additional 3 single-family units were permitted in 2021); no multi-family units were built during this time frame. Thirty of the 41 single-family residences added are the Karuk Homes #1, an affordable housing development. Approximately 41 percent of the city’s housing stock was built prior to 1970 (2015-2019 ACS Five-Year Estimates). Therefore, based on age alone, it is likely that roughly half of the city’s housing stock needs some form of rehabilitation. However, at the time of the City’s 2013 Housing Conditions Survey, only 41 units were noted as needing more than minor repairs. Since 2000, the number of total housing units has increased by about 11 percent, while the vacancy rate has increased by approximately 1 percent (2000 US Census, 2015-2019 ACS). Most single-family residential construction has been two-, three-, and four-bedroom units. Most of the overcrowded conditions in the city occur among renter- occupied households, with 1.5 percent of renter households being overcrowded compared to less than 1 percent of owner-occupied households (2015-2019 ACS Five-Year Estimates).
The California Association of Realtors reports that the Siskiyou County median home sales price in October 2021 was $329,500. At the time of the January rental housing costs survey, less than 15 rental units were found available in the city. There were three two-bedroom apartments/houses available for rent for $756 to $1,500 per month and three three-bedrooms available for rent for $862 to $1,250 per month.
2.4. HOUSING CONSTRAINTS
Section titled “2.4. HOUSING CONSTRAINTS”2.4.1. GOVERNMENTAL CONSTRAINTS
Section titled “2.4.1. GOVERNMENTAL CONSTRAINTS”Development standards in the city do not necessarily constrain development, however higher-density multifamily housing types currently require a conditional use permit. Permit processing times are approximately one day to one month to three months and can be as long as nine to twelve when discretionary review is needed. Projects requiring California Environmental Quality Act (CEQA) review may take longer than six months. The previous housing element did not consider the discretionary permit, process when required, to be constraint. This Housing Element, however, identifies the discretionary process to be a constraint to housing production in the City, and is discussed below in section 4.1.2(A). Yreka is presently subject to ministerial streamlining provisions of SB 35 (2017), like many jurisdictions in California. SB 35 allows developers of qualifying housing projects to invoke SB 35’s ministerial streamlining provisions that override the City’s discretionary permitting process while meeting objective development and design standards. To be eligible for SB 35 housing projects must meet provisions for affordability, housing type, site conditions, and labor in order to benefit from the ministerial approval process. At this time Yreka does not have written SB 35 procedures, although City staff is familiar with SB 35 and consults HCD’s Streamlined Ministerial Approval Process Guidelines and other published materials on the State’s website when responding to prospective housing proposals. Program HE-1.3.7 commits Yreka to preparing written procedures and forms, that are consistent with state law, to implement SB 35. As part of Program HE-1.3.7, the City will publish their written procedures on their website, and make all of their SB 35 forms and materials available for download by the public. Yreka will also make their SB 35 procedures and forms available at the Planning Department’s public information counter. Program HE-1.3.7 is to be completed within one year from when the City adopts the housing element.
2.4.2. NON-GOVERNMENTAL CONSTRAINTS
Section titled “2.4.2. NON-GOVERNMENTAL CONSTRAINTS”The availability and cost of housing is strongly influenced by market factors which the City government has little or no control over. State and national economic conditions have a considerable effect on the pace of local development, the availability of financing and mortgage interest rates. A number of costs associated with home building, such as site development (i.e., grading, installation of utilities, constructions of streets, and construction itself) cannot be greatly lessened by the County government. The primary non-governmental constraints to the development of new housing can be broken down into four categories: land costs, site development costs, construction costs, and availability of financing. According to an Internet search conducted in July2022 (survey included www.zillow.com, www.sellingsiskiyou.com, www.realtor.com, and www.richterscalere.com), vacant land prices ranged from $13,770 to $446,028 per acre for land zoned for single-family uses and $128,278 per acre to $271,278 per acre for land zoned for multi- family use. The average construction cost for a 1,500-square-foot single-family home is estimated to be approximately $465,385 (Cost to Build 20222).
3. REGIONAL CONTEXT
Section titled “3. REGIONAL CONTEXT”Yreka is located 25 miles from the Oregon border in central Siskiyou County. It straddles Interstate 5 and is serviced by State Routes 3 and 263. The city is both a rural community and the County seat. The city was founded with the discovery of gold in March 1851, and during the initial eight to nine years of mining, grew from a population of 375 to more than 5,000. Today it is the most populous city in the county with a population of approximately 7,800. The population has fluctuated over the years, but overall growth has been relatively slow and steady. Since 1980, the city has experienced an average annual growth rate of approximately one-half of 1 percent. Between 2010 and 2020, the population remained nearly static, growing approximately one-half of 1 percent over the ten years (see Table A-1). With growing industries in the area, the main growth limiting factor in the region is likely the availably of affordable homes.
Table A-1 Siskiyou County Population Change, 2000-2020
| City | 2000 Population | 2010 Population | Percentage Change 2000-2010 | 2020 Population | Percentage Change 2010-2020 |
|---|---|---|---|---|---|
| Yreka | 7,290 | 7,765 | 7% | 7,807 | 0.5% |
| Fort Jones | 660 | 839 | 27% | 695 | -20.7% |
| Etna | 781 | 737 | -6% | 678 | -8.7% |
| Montague | 1,456 | 1,443 | -1% | 1,226 | -17.7% |
| Dorris | 886 | 939 | 6% | 860 | -9.2% |
| Tulelake | 1,020 | 1,010 | -1% | 902 | -12.0% |
| Weed | 2,978 | 2,967 | 0% | 2,862 | -3.7% |
| Mt. Shasta | 3,621 | 3,394 | -6% | 3,223 | -5.3% |
| Dunsmuir | 1,923 | 1,650 | -14% | 1,707 | 3.3% |
| Unincorporated | 23,686 | 24,156 | 2% | 24,116 | -0.2% |
Source: 2000, 2010, 2020 U.S. Decennial Census.
3.1. POPULATION TRENDS
Section titled “3.1. POPULATION TRENDS”The population of Yreka increased 8 percent from 7,290 in 2000 to 7,807 in 2020, which represents an annual growth rate of less than 1 percent since 2000. Although this growth is considerably lower than is typical of California’s more urbanized centers, it is fairly common for rural Siskiyou County.
Population projections for Yreka are not currently available. The DOF provides projections for the unincorporated area and all the cities through 2060. Table A-2 shows the expected population for both the incorporated and unincorporated portions of Siskiyou County from 2010 to 2060. Based on DOF projections, the county is expected to experience an annual growth rate of less than three-tenths of 1 percent through 2060. Based on the city’s historic growth rate and the current housing crisis throughout the state, it is likely that Yreka’s future growth rate will resemble the growth rate projected for Siskiyou County.
Table A-2 Population Projections, 2010-2060
| 2010 | 2020 | 2030 | 2040 | 2050 | 2060 | |
|---|---|---|---|---|---|---|
| SiskiyouCounty | 44,893 | 44,076 | 48,883 | 51,854 | 52,130 | 52,646 |
Source: DOF, Report P-3: State and County Population Projections by Race/Ethnicity, Detailed Age, and Gender, 2010-2060, 2021
The distribution of Yreka’s population by age group is shown in Table A-3. Although the absolute number of residents changed for each category between 2000 and 2019, the proportion of most age categories remained relatively static. The largest changes were for ages 25-34 which increased from 9% to 16%. The second largest change was a decrease in ages 45-54 from 14% to 8% proportionately. Table A-4 reports age by householder,
24%
22%
20%
18%
16%
14%
12%
10%
8%
6%
4%
2%
0% which is another way of illustrating how age is distributed in the city. The majority of renters are between 25 and 44 years old, while most owners are between 65 and 74 years old.
Table A-3 Population by Age, 2000-2019
| Age | 2000 | 2000 | 2010 | 2010 | 2019* | 2019* |
|---|---|---|---|---|---|---|
| Age | Persons | Percentage | Persons | Percentage | Persons | Percentage |
| <5 | 404 | 6% | 592 | 8% | 608 | 8.0% |
| 5-14 | 1,068 | 15% | 972 | 13% | 1,111 | 14.7% |
| 15-24 | 953 | 13% | 985 | 13% | 726 | 9.6% |
| 25-34 | 676 | 9% | 814 | 10% | 1,217 | 16.1% |
| 35-44 | 1,039 | 14% | 789 | 10% | 945 | 12.5% |
| 45-54 | 1,013 | 14% | 1,076 | 14% | 597 | 7.9% |
| 55-64 | 724 | 10% | 1,043 | 13% | 844 | 11.2% |
| 65+ | 1,413 | 19% | 1,494 | 19% | 1,514 | 20.0% |
| Total | 7,290 | 100% | 7,765 | 100% | 7,562 | 100% |
Source: 2000, 2010 US Census, Table P12; 2015-2019 ACS, Table DP05
Figure 1: Yreka Population by Age
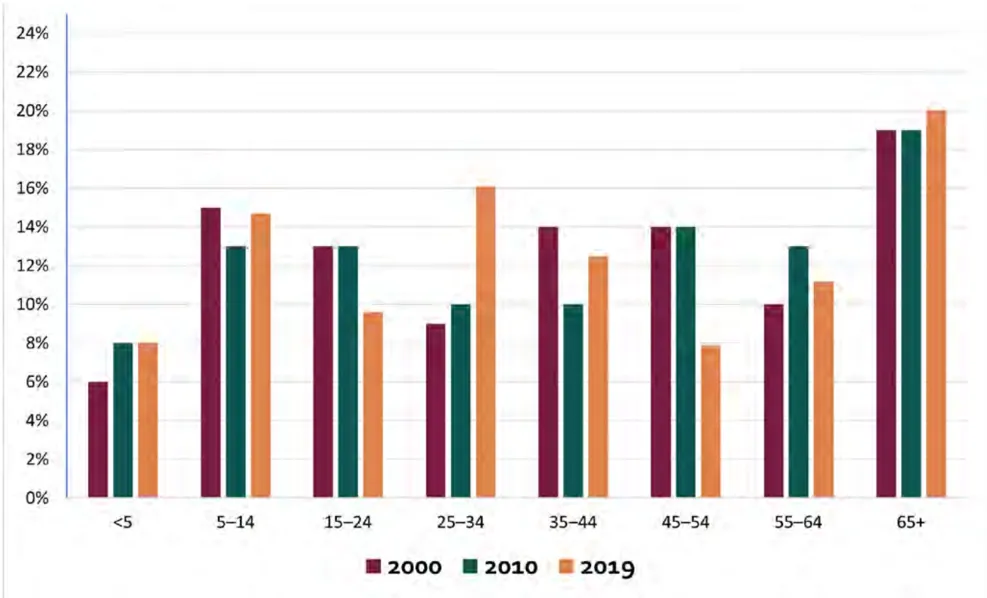
<5
Table A-4 Householder by Age, 2019
| Householder Type | Number | Percentage of Total |
|---|---|---|
| Owner-Occupied | 1,998 | 59% |
| Householder 15 to 24 years | 10 | 0% |
| Householder 25 to 34 years | 321 | 9% |
| Householder 35 to 44 years | 220 | 6% |
| Householder 45 to 54 years | 255 | 7% |
| Householder 55 to 59 years | 239 | 7% |
| Householder 60 to 64 years | 116 | 3% |
| Householder 65 to 74 years | 495 | 15% |
| Householder 75 to 84 years | 266 | 8% |
| Householder 85 years and over | 76 | 2% |
| Renter-Occupied | 1,404 | 41% |
| Householder 15 to 24 years | 194 | 6% |
| Householder 25 to 34 years | 256 | 8% |
| Householder 35 to 44 years | 265 | 8% |
| Householder 45 to 54 years | 153 | 4% |
| Householder 55 to 59 years | 85 | 2% |
| Householder 60 to 64 years | 107 | 3% |
| Householder 65 to 74 years | 213 | 6% |
| Householder 75 to 84 years | 92 | 3% |
| Householder 85 years and over | 39 | 1% |
| Total | 3,402 | 100% |
Source: 2015-2019 ACS
Table A-5 shows the racial and ethnic composition of the City of Yreka alongside the same data for Siskiyou county. Persons who identify as White, non-Hispanic–Latino comprise nearly 86 percent of the City’s population; persons who are Hispanic or Latino are the next largest ethnic group comprising 12.3 percent of the City’s population. Persons who are Native Americans are the next largest racial group at almost 10 percent of the population. The number of persons in these three racial and ethnic groups increased from 2010 to 2020 in the City. As a percentage of the population, Siskiyou county’s racial and ethnic composition is similar. Siskiyou county also saw similar population increases for these same groups. The City saw a greater increase in the number of Native Americans in comparison to the Siskiyou county.
Table A-5 City of Yreka & Siskiyou County 2010 and 2020 Racial and Ethnic Data
| City of Yreka | City of Yreka | City of Yreka | City of Yreka | City of Yreka | Siskiyou County | Siskiyou County | Siskiyou County | Siskiyou County | Siskiyou County | |
|---|---|---|---|---|---|---|---|---|---|---|
| 2010 | % | 2020 | % | ’10- ’20 ∆ | 2010 | % | 2020 | % | ’10- ’20 ∆ | |
| Total | 7,765 | 100% | 7,807 | 0.5% | 44,900 | 100% | 44,207 | -1.5% | ||
| Hispanic or Latino | 753 | 9.7% | 958 | 12.3% | 27% | 4,615 | 10.3% | 5,527 | 12.5% | 20% |
| Not Hispanic or Latino | 7,012 | 90.3% | 6,849 | 87.7% | -2% | 40,285 | 89.7% | 38,549 | 87.2% | -4% |
| Population of One Race: | 6,649 | 85.6% | 6,192 | 79.3% | -7% | 38,445 | 85.6% | 35,454 | 80.2% | -8% |
| White Alone | 6,078 | 78.3% | 5,314 | 85.8% | -13% | 35,683 | 79.5% | 32,057 | 90.4% | -10.2% |
| Black or African American | 53 | 0.7% | 66 | 1.1% | 25% | 552 | 1.2% | 471 | 1.3% | -15% |
| American Indian and Alaska Native | 413 | 5.3% | 616 | 9.9% | 49% | 1,549 | 3.4% | 1,757 | 5% | 13% |
| Asian Alone | 90 | 1.2% | 147 | 2.4% | 63% | 528 | 1.2% | 866 | 2.4% | 64% |
| Native Hawaiian and Other Pacific Islander | 8 | 0.1% | 10 | 0.2% | 25% | 69 | 0.2% | 38 | 0.1% | -45% |
| Some Other Race | 7 | 0.1% | 39 | 0.6% | 457% | 64 | 0.1% | 265 | 0.8% | 314% |
| Population of Two Races | 321 | 4.1% | 612 | 8.4% | 91% | 1,840 | 4.1% | 2,894 | 6.6% | 69% |
| White; Black or African American | 26 | 8.1% | 47 | 7.7% | 81% | 153 | 8.9% | 262 | 9.1% | 71% |
| White; American Indian and Alaska Native | 225 | 70.1% | 402 | 65.7% | 78% | 1,196 | 69.8% | 1,708 | 59% | 43% |
| White; Asian | 40 | 12.5% | 58 | 9.5% | 45% | 186 | 10.9% | 277 | 9.6% | 49% |
| White; Some Other Race | 5 | 1.6% | 77 | 2.3% | 1440% | 50 | 2.9% | 466 | 16.1% | 832% |
| White; Native Hawaiian and Other Pacific Islander | 3 | 0.9% | 14 | 12.6% | 367% | 22 | 1.3% | 79 | 2.7% | 259% |
| All Other | 22 | 6.9% | 14 | 2.3% | -36% | 107 | 6.2% | 102 | 3.5% | -4.7% |
| Population of Three or More Races | 42 | 0.5% | 45 | 0.6% | 7% | 126 | 0.3% | 201 | 0.5% | 59.5% |
Source: 2010 and 2020 US Census, Table P2
Table A-6 Yreka Changes in Household Type, 2010-2020
| HouseholdType | 2010 | 2010 | 2020 | 2020 | %ChangeFrom 2010 to 2020 |
|---|---|---|---|---|---|
| Number | Percentage | Number | Percentage | %ChangeFrom 2010 to 2020 | |
| Household Populations 2 | |||||
| Total Households | 3,360 | 100 | 3,407 | 100 | 1.4 |
| Average Household Size | 2.44 | 2.21 | (19.4) | ||
| Family Households (families) | 1,970 | 58.6 | 1,763 | 51.7 | (10.5) |
| Average Family Size | 2.91 | 3.04 | 4.5 | ||
| Married-CoupleFamilies | 1,281 | 65.0 | 1,195 | 67.8 | (6.7) |
| With Children | 494 | 38.6 | 482 | 40.3 | (2.4) |
| FemaleHouseholder,no spouse | 591 | 30 | 365 | 20.7 | (38.2) |
| With Children | 378 | 64 | 260 | 71.2 | (31.2) |
| Male Householder, no spouse | 98 | 5.0 | 203 | 11.5 | 107.1 |
| With Children | 32 | 32.7 | 149 | 73.4 | 366 |
| Non-Family Households | 1,390 | 41.4 | 1,644 | 48.3 | 18.3 |
| Group Quarters (Non-Household Population) | Group Quarters (Non-Household Population) | Group Quarters (Non-Household Population) | Group Quarters (Non-Household Population) | Group Quarters (Non-Household Population) | Group Quarters (Non-Household Population) |
| City of Yreka | 149 | 50 | (66) | ||
| Siskiyou County | 950 | 566 | (40) |
Sources: American Community Survey, 2010 and 2020, Table S1101 and Table B26001. Negative values are shown in parathesis.
The American Community Survey (ACS) 2010 and 2020 data for household types including group quarters are presented in Table A-6. The data indicates changes in family and non-family households in Yreka from 2010 to 2020. A family household is a householder living with one or more individuals who are living in the home and who are related to the householder by birth, marriage or adoption.3 A non-family household consists of the householder living alone or the home is occupied exclusively by unrelated people.4 People who are not living in housing units are living in group quarters of which there are two types: institutional and non-institutional. Correctional facilities and nursing homes are examples of institutional group quarters. College dormitories, military barracks, group homes, and shelters are examples of non-institutional group quarters.
The 2010 and 2020 ACS data presented in Table A-6 indicates while the total number of households increased 1.4 percent from 2010 to 2020, the total number of family households decreased by 10.5 percent from 2010 to 2020, while the non-family households increased more than 18 percent in the same period. The average household size decreased from 2.44 to 2.21 persons, or more than 19 percent. These data indicate a greater number of people are living with smaller households and a possible increase in the number of householders living alone from 2010 to 2020.
The total number of single-parent households was nearly identical in 2010 and 2020: 410 and 409. From 2010 to 2020, the number of female householders (no spouse) no children decreased nearly 40 percent, the number of male householders (no spouse) no children increased 107 percent. Although there was a decline in the number of female householders with children, the percentage female householders (no spouse) with children increased relative to female householders without children: 64 precent in 2010 to 71 percent in 2020. The most dramatic changes are reported for mail householders (no spouse) with children: In 2020, 75 percent of male householders, no spouse, had children, whereas in 2010, nearly 33 percent of male householders, no spouse, had children. however, increased significantly from 2010. Single parent households, particularly female-headed households, generally have lower-incomes and higher living expenses, often making the search for affordable, decent, and safe housing more difficult. In addition to difficulties faced by these households in finding and maintaining affordable housing, these households also typically have additional special needs relating to access to day care/childcare, health care and other supportive services.
Group quarter facilities are living situation where people live or stay that is not a housing unit, (house, apartment, mobile home, rented rooms). There are two types of group quarters institutional and non-institutional. Examples of institutional group quarters are correctional facilities, nursing homes, or mental hospitals. College dormitories, military barracks, group homes, missions or shelters are examples of non-institutional group quarters. According to the most recent American Community Survey, from 2010 to 2020, both Yreka and Siskiyou county saw a decrease in the population residing in group quarters, with Yreka having the larger decrease: Yreka’s population in group quarters decreased from 149 persons in 2010 to 50 individuals in 2020. Local changes are consistent with the overall trend for California where the total population in group quarters decreased overall from an estimated population of 826,697 individuals to 824,735 individuals in 2020.
3.2. HOUSEHOLD INCOME AND POVERTY
Section titled “3.2. HOUSEHOLD INCOME AND POVERTY”Yreka and Siskiyou county have relatively low income levels in comparison to California. Both Siskiyou county and Yreka are considered a low-income community because both have a median income that is 80 percent or less of the 2022 statewide median income of $78,672. For housing to be affordable it must be within a household’s budget.
3.2.1. INCOME LIMITS
Section titled “3.2.1. INCOME LIMITS”The State of California publishes annual income limits for each county that are used to determine eligibility for assisted housing programs within that county. The California Health and Safety Code requires that the state limits for the low-, very low-, and extremely low-income categories will be the same as those in the equivalent levels established by the US Department of Housing and Urban Development (HUD) for its Section 8 program. HCD calculates the 2022 area median income (AMI) for Siskiyou county to be $80,300. Table A-7 below presents the 2022 State income limits for Siskiyou county by household size.
Table A-7 2022 State Annual Income Limits, Siskiyou County
| Income Category | Number of Persons in Household | Number of Persons in Household | Number of Persons in Household | Number of Persons in Household | Number of Persons in Household | Number of Persons in Household | Number of Persons in Household | Number of Persons in Household |
|---|---|---|---|---|---|---|---|---|
| Income Category | 1 | 2 | 3 | 4 | 5 | 6 | 7 | 8 |
| Extremely Low Income (<30% of AMI) | $16,350 | $18,700 | $23,030 | $27,750 | $32,470 | $37,190 | $41,910 | $46,630 |
| Very Low Income (30- 50%of AMI) | $27,300 | $31,200 | $35,100 | $38,950 | $42,100 | $45,200 | $48,300 | $51,450 |
| Low Income (50-80% of AMI) | $43,650 | $49,850 | $56,100 | $62,300 | $67,300 | $72,300 | $77,300 | $82,250 |
| Median Income | $56,200 | $64,250 | $72,250 | $80,300 | $86,700 | $93,150 | $99,550 | $106,000 |
| Moderate Income (80- 100% AMI) | $67,450 | $77,100 | $86,700 | $96,350 | $104,050 | $111,750 | $119,450 | $127,200 |
| Above Moderate Income* (>100% AMI) | $68,002 | $77,743 | $87,423 | $97,163 | $104,907 | $112,712 | $120,456 | $128,260 |
‘AMI’ = area median income, which was $80,300 for Siskiyou County according to HCD’s 2022 publication.
- Above Moderate Income values are calculated as 121% of median income.
Source: HCD 2022, https://www.hcd.ca.gov/docs/grants-and-funding/inc2k22.pdf
3.2.2. INCOME LEVELS AND EXTREMELY-LOW INCOME HOUSEHOLDS
Section titled “3.2.2. INCOME LEVELS AND EXTREMELY-LOW INCOME HOUSEHOLDS”Extremely Low-Income (ELI) households are those that earn 30 percent of the area median income or less. In Yreka this amounts to an annual income of $16,350 for an individual and $27,750 for a family of four, as indicated in Table A-7 above. Many ELI households live in rental housing and are more likely to be cost burdened, and face overcrowding and substandard housing conditions, and are at risk of displacement. Some ELI households are recipients of public assistance such as social security insurance or disability insurance. Housing types available and suitable for ELI households include affordable rentals, accessory dwelling units, permanent supportive housing, transitional housing, and emergency shelters. During much of the City’s 5th cycle, housing production for all income categories was low. The City also faced staffing difficulties which diminished the effectiveness of many of the City’s 5th cycle programs, including those aimed at facilitating production of ELI housing. More recently, however, the City has actively supported and facilitated two affordable housing developments within city limits: Siskiyou Crossroads, a 100 percent assisted development with supportive housing units, and Karuk Home 1, a Karuk Tribe Housing Authority project.
Table A-8 summarizes Yreka’s by income and household type, and Table A-10 summarizes Yreka households by income and tenure. As shown in Table A-8, 10.2 percent of nonfamily households make less than $10,000 each year and 15.3 percent earn between $10,000 and $14,999. Based on the ELI threshold of $16,350 for households of one, these households can be considered extremely low income. Because the ELI threshold for a family of four ($27,750) falls between income categories in the data, not all family households making $27,750 or less can be considered extremely low income, although 15.1 percent of families make less than $25,000. This results in the actual cost of housing, both ownership and rental, oftentimes being financially burdensome for many households. Cost burdened is defined as households pay more than 30 percent of their gross household income toward housing, and households paying more than 50 percent of their gross income are severely cost burdened. Cost burdened households are more likely to face overcrowding.
Table A-8 Yreka Household Income by Household Type, 2021
| Total Households | Families | Nonfamily households | |
|---|---|---|---|
| Total | 3,210 | 1,703 | 1,507 |
| Less than $10,000 | 6.3% | 2.8% | 10.2% |
| $10,000 to $14,999 | 8.6% | 3.2% | 15.3% |
| $15,000 to $24,999 | 15.0% | 9.1% | 21.7% |
| $25,000 to $34,999 | 8.0% | 8.4% | 9.0% |
| $35,000 to $49,999 | 16.9% | 18.0% | 16.3% |
| $50,000 to $74,999 | 15.0% | 19.4% | 12.5% |
| $75,000 to $99,999 | 9.2% | 12.4% | 6.6% |
| $100,000 to $149,999 | 11.9% | 15.6% | 5.2% |
| $150,000 to $199,999 | 6.9% | 6.8% | 3.1% |
| $200,000 or more | 2.3% | 4.3% | 0.0% |
Source: 2019 ACS 5-Year Estimates, Table S1901
Table A-9 illustrates similar data to Table A-8, but shows the number of households in each income group based on 2015-2019 ACS Five-Year Estimates. Over ten percent of all households fall into the extremely low-income category. Approximately 58 percent of the city’s households have incomes at or below the low-income limit. The remaining 43 percent of households have incomes above the low-income limit (8 percent of households earn incomes that fall into the moderate-income category; 35 percent of households fall into the above moderate-income category).
Table A-9 Households by Income Group, 2019
| Income Group | Income | Households | % |
|---|---|---|---|
| Extremely Low (Below 30% of Median Income) | <$12,745 | 445 | 13% |
| Very Low (30-50% of Median Income) | $12,745-$21,242 | 239 | 7% |
| Low (50-80% of Median Income) | $21,242-$33,987 | 598 | 18% |
| Moderate (80-10% of Median Income) | $33,987-$50,980 | 667 | 20% |
| Above Moderate (Over 120% of Median Income) | >$50,980 | 1,453 | 43% |
| Total Households | 3,402 |
Source: Estimates are based on 2015-2019 ACS Five-Year Estimates.
Table A-10 illustrates the income distribution in 2010 and 2019 by tenure. This data indicates that owneroccupied households earned about 55 percent more than renter-occupied households in 2019, or $53,611 and $29,662, respectively. Although the median renter household income increased by nearly $10,000 from 2010, this is only $1,912 greater than the extremely low income limit for a household of four as presented in Table A-7 above.
Table A-10 Household Income by Tenure, 2010 and 2019
| 2010 | 2010 | 2019 | 2019 | |
|---|---|---|---|---|
| Income | Households | Percentage of Total | Households | Percentage of Total |
| Owner-Occupied Households | ||||
| Less than 10,000 | 86 | 5% | 141 | 4% |
| $10,000 to $14,999 | 165 | 5% | 131 | 4% |
| $15,000 to $19,999 | 111 | 3% | 26 | 1% |
| $20,000 to $24,999 | 57 | 2% | 68 | 2% |
| $25,000 to $34,999 | 199 | 6% | 178 | 5% |
| $35,000 to $49,999 | 265 | 8% | 424 | 12% |
| $50,000 to $74,999 | 255 | 8% | 343 | 10% |
| $75,000 to $99,999 | 270 | 8% | 272 | 8% |
| $100,000 or more | 242 | 7% | 415 | 12% |
| Total Owner-Occupied | 1,650 | 52% | 1,998 | 59% |
| Renter-Occupied Households | ||||
| Less than 10,000 | 241 | 7% | 123 | 4% |
| $10,000 to $14,999 | 387 | 12% | 195 | 6% |
| $15,000 to $19,999 | 205 | 6% | 107 | 3% |
| $20,000 to $24,999 | 93 | 3% | 153 | 4% |
| $25,000 to $34,999 | 140 | 4% | 180 | 5% |
| $35,000 to $49,999 | 205 | 6% | 222 | 7% |
| $50,000 to $74,999 | 185 | 6% | 239 | 7% |
| $75,000 to $99,999 | 104 | 3% | 57 | 2% |
| $100,000 or more | 18 | 1% | 128 | 4% |
| Total Renter-Occupied | 1,578 | 48% | 1,404 | 41% |
| Median Income - Owners $47,718 | Median Income - Owners $47,718 | Median Income - Owners $47,718 | $53,611 | $53,611 |
| Median Income - Renters | Median Income - Renters | $19,281 $29,662 | $19,281 $29,662 |
Source: 2010 US Census, Summary File 3; 2015-2019 ACS Five-Year Estimates, Table S2503
As presented in Table A-42 below, 25 percent of households who own their own are cost burdened and 57 percent rent households are cost burdened. ELI households have the highest cost burden: nearly 80 percent of ELI households who own their home are paying more than 30 of their gross income towards housing, and nearly 85 of renter households are cost burdened.
A. Extremely Low Income Household Housing Need Projection
Section titled “A. Extremely Low Income Household Housing Need Projection”As discussed below in Section 4.3.9, Yreka’s 6th cycle RHNA is for two housing units: one low income unit and one very low income unit. As required by statute, at least 50 percent of a jurisdiction’s very low income RHNA must be categorized as ELI. In addition to the one low income unit and one very low income unit, City assigns itself one (1) ELI unit, resulting in a total of three (3) units for its 6th cycle RHNA.
Table A-11 illustrates the tenure by housing unit type in the year 2019. The majority of owner-occupied households occupied single-family housing units; the majority of renter-occupied households occupied multifamily housing units.
Table A-11 Tenure by Single- and Multi-Family Occupied Housing Units, 2019
| UnitType | Owner-Occupied | Renter-Occupied | Total |
|---|---|---|---|
| Single-Family | 1,770 | 544 | 2,314 |
| Multi-Family | 8 | 821 | 829 |
| MobileHome | 220 | 39 | 259 |
| Total | Total | 3,402 |
Source: 2019 2015-2019 ACS Five-Year Estimates
3.2.3. COMMUTE
Section titled “3.2.3. COMMUTE”Commute distance is an important factor in housing availability and affordability and is also an indicator of jobs/housing balance. Communities with extended commute distances generally have a poor jobs/housing balance, while those with short average commutes tend to have a strong jobs/housing balance. The burden of the additional costs associated with extended commuting disproportionately affects lower-income households who must spend a larger portion of their overall income on fuel. This in turn affects a household’s ability to occupy decent housing without being overburdened by cost. Table A-12 indicates that the vast majority of Yreka residents travel less than 30 minutes from home to work. This data indicates that many of the jobs are within 20 miles of the city and that there is a strong jobs/housing balance, meaning that the available jobs are within relatively close distance to the employees’ places of residence.
Table A-12 Travel Time to Work
| Travel Time to Work | Number | Percentage |
|---|---|---|
| Less than 30 minutes | 2,429 | 88% |
| 30 to 59 minutes | 287 | 10% |
| 60 or more minutes | 43 | 2% |
| Total | 2,759 | 100% |
Source: ACS 2015-2019 Five-Year Estimates
3.2.4. EMPLOYMENT
Section titled “3.2.4. EMPLOYMENT”The region’s fastest growing occupations are listed in Table A-13. This information is only available for the Northern Counties Region, not for Yreka, but is applicable because Yreka residents work both inside and outside of the city. According to HCD, the 2019 Siskiyou County median income for a family of four is $65,579. Of the ten fastest growing occupations, only two have a median hourly wage that is on par with the county’s median hourly wage, construction managers and medical and health services managers. Figure 2 identifies the county’s largest employers by city which employ at least 100 people, and Table A-14 presents employment and median income by industry, which is an aggregated version of the finer scaled occupation data presented in Table A-13.
Figure 2: Yreka’s Largest Employers,
Section titled “Figure 2: Yreka’s Largest Employers,”- Fairchild Medical Clinic
- Fairchild Medical Center
- Nor-Cal Products Inc
- Raley’s
- Siskiyou County Public Works
- Walmart Supercenter
Source: City of Yreka
Table A-13 Fastest Growing Occupations, 2018-2028
| Median Hourly | Estimated Employment | Estimated Employment | Percentage Change | |
|---|---|---|---|---|
| Occupation | Wage* | 2018 | 2028 | |
| Construction Managers | $52.59 | 440 | 530 | 20% |
| Medical and Health Services Managers | $64.86 | 240 | 320 | 33% |
| Market Research Analysts and Marketing Specialists | $25.00 | 190 | 230 | 21% |
| Substance Abuse, Behavioral Disorder, and Mental Health Counselors | $22.56 | 320 | 390 | 22% |
| Medical Assistants | $19.99 | 400 | 470 | 18% |
| Cooks, Restaurant | $17.01 | 1,020 | 1,250 | 23% |
| Animal Caretakers | $16.37 | 200 | 240 | 20% |
| Industrial Machinery Mechanics | $27.47 | 250 | 300 | 20% |
Source: Siskiyou County Profile, State of California Employment Development Department, accessed 2021.
- 2021 Q1 Mean Hourly Wage from Occupational Employment and Wage Statistics (OEWS) Survey Results.
Table A-14 Yreka Employment and Median Income by Industry, 2019
| Industry | Employed | Percent | Median Income |
|---|---|---|---|
| Educational services, and health care and social assistance | 766 | 26% | $39,792 |
| Retail trade | 269 | 9% | $20,076 |
| Arts, entertainment, and recreation, and accommodation and food services | 345 | 12% | $12,422 |
| Transportation and warehousing, and utilities | 140 | 5% | $86,250 |
| Public administration | 260 | 9% | $52,167 |
| Finance and insurance, and real estate and rental and leasing | 122 | 4% | $30,455 |
| Professional, scientific, and management, and administrative and waste management services | 265 | 9% | $28,194 |
| Other services, except public administration | 143 | 5% | $24,450 |
| Construction | 99 | 3% | $38,125 |
| Manufacturing | 219 | 7% | $32,734 |
| Agriculture, forestry, fishing and hunting, and mining | 209 | 7% | $39,250 |
| Wholesale trade | 100 | 3% | $28,988 |
| Information | 61 | 2% | $46,406 |
| Civilian employed population 16 years and over | 2,998 | 100% | $32,243 |
Source: 2015-2019 ACS Five-Year Estimates
3.3. SPECIAL NEEDS
Section titled “3.3. SPECIAL NEEDS”3.3.1. ELDERLY AND INDEPENDENT LIVING SERVICES
Section titled “3.3.1. ELDERLY AND INDEPENDENT LIVING SERVICES”The City of Yreka financially and politically supports the Madrone Hospice, Inc., which provides senior services, and Siskiyou County Health and Human Services to provide residents that are over the age of 65 years old with food security, health, and social services. These services are provided at the Yreka Community Center through senior lunches, Siskiyou County Health and Human Services facility on Main Street, and remotely to individuals who are unable to leave their homes due to medical condition or inability to drive or walk.
Elderly residents can participate in fresh, cooked meals delivered to their doorstep through the Senior Nutrition, Transportation, and Family Caregiver Support Programs. The Madrone program has not provided congregate dining since the advent of the pandemic but will begin those services again once COVID has further subsided due to the vulnerable nature of our elderly residents. In addition to food programs, Madrone provides seniors with information and programs on caregivers, community services, education on senior specific topic areas, handicap ramp installation, and transit options.
Siskiyou County Health and Human Services provides county and city residents with healthcare and social services. The county provides adult protection services, in-home supportive services, public guardians, and administrators of estates. These services allow residents to live independently of an assisted living facility and helps guardians caring for elderly or individuals unable to live independently.
Dutra’s Guest House (RCFE License)
Barker’s Residential Care
A Touch of Home
Meadowlark Assisted Living & Memory Care Community
Shepherd of God Assisted Living LLC
Care ‘n’ Hearts, Inc.
Shasta View Nursing Center
Eskaton President G. Washington
Shasta Manor I and II
Laurel Crest Manor Residential Care
3.3.2. SENIOR POPULATION
Section titled “3.3.2. SENIOR POPULATION”Table A-15 illustrates the population of residents aged 65 and older in 2000, 2010, and 2019. The proportion of retirement-age residents aged 65 to 74 and 75 and older remained nearly constant between 2000 and 2010 but changed slightly in 2019. From 2010 to 2019 there was an 18% increase in seniors aged 65-74, while seniors aged 75 and over decreased by 18%.
Table A-15 Senior Population, 2000-2019
| Age Group | 2000 | 2000 | 2010 | 2010 | 2019 | 2019 |
|---|---|---|---|---|---|---|
| Age Group | Persons | Percentage | Persons | Percentage | Persons | Percentage |
| 65 to 74 years | 615 | 44% | 692 | 46% | 962 | 64% |
| 75 and over | 798 | 56% | 802 | 54% | 552 | 36% |
| Total Seniors | 1,413 | 100% | 1,494 | 100% | 1,514 | 100% |
Source: 2000 US Census, 2010 US Census, 2019 ACS Five-Year Estimates
Table A-16 illustrates the tenure of senior households in the city. The majority of senior households own their homes. The proportion of owner-occupied and renter-occupied senior households has remained relatively consistent since 2000.
Table A-16 Senior Households by Tenure, 2000-2019
| 2000 | 2000 | 2010 | 2010 | 2019 | 2019 | |
|---|---|---|---|---|---|---|
| Households | Percentage | Households | Percentage | Households | Percentage | |
| Owner-Occupied | ||||||
| 65 to 74 years | 275 | 27% | 295 | 32% | 495 | 42% |
| 75 years and older | 461 | 45% | 332 | 35% | 342 | 29% |
| Total Owner-Occupied | 736 | 72% | 627 | 67% | 837 | 71% |
| Renter-Occupied | ||||||
| 65 to 74 years | 86 | 9% | 131 | 14% | 213 | 18% |
| 75 years and older | 196 | 19% | 175 | 19% | 131 | 11% |
| Total Renter-Occupied | 282 | 28% | 306 | 33% | 344 | 29% |
| Total Senior Households | 1,018 | 100% | 933 | 100% | 1,181 | 100% |
Source: 2000 US Census, 2010 US Census, 2019 ACS Five-Year Estimates
3.3.3. PERSONS WITH DISABILITIES
Section titled “3.3.3. PERSONS WITH DISABILITIES”Based on a total population estimate of 7,559 persons for the City of Yreka, 19 percent residents are experiencing a disability. Table A-17 indicates the largest age group of noninstitutionalized persons with disabilities are 65 years and older, comprising 39 percent of the City’s total population. For persons with disabilities Table A-18 provides information about the types of challenges and difficulties that may require accommodation and accessible features in dwellings, such as wheelchair ramps, special doorbells, roll-in showers, high-set toilets, or other adaptive devices or medical equipment.
Table A-17 Yreka Population with a Disability by Age
| With a Disability | With a Disability | With a Disability | |||
|---|---|---|---|---|---|
| Total Population | Total Population | %ofTl. Population | |||
| Under 18 years (0-17) | 1,938 | 26% | 173 | 12% | 9% |
| 18-64 years | 3,946 | 52% | 600 | 42% | 15% |
| 65 Years &Older | 1,675 | 22% | 660 | 46% | 39% |
| Total | 7,5595 | 100% | 1,433 | 100% | 19% |
2020 ACS 5-Year Estimates Subject Tables Table S1810
Table A-18 indicates the most common disabilities of Yreka residents are hearing and vision, and these are most likely to occur for residents who are 65 and older. It is noted that Table A-4 reports that the number of residents 65 and older in Yreka increased from 2000 to 2019. Fifty-three percent of the 65 and older Yreka population also experiences ambulatory difficulties. Table A-3 and Figure 1 also show that persons who are 65 and older are the largest age group in the City’s, and Table A-4 also reports that persons who are 65-75 are most likely to own and live in their home. While the City updated its reasonable accommodation procedures as part of the previous housing element, to ensure the procedures comport with current federal and state law, Program HE-6.1.2 commits the City to undertaking a review and initiating any needed updates, and the following activities:
- Codifying the procedures so they are made part of the Zoning Code,
- Inclusion of language that reasonable accommodation extends and applies to the City’s parking regulations.
- Inclusion of language that providers of housing for persons with disabilities may request reasonable accommodation.
- Developing and marketing the availability of the procedures on a regular basis
According to Table A-17 and Table A-18, persons in the 18-64 age group who have disabilities make up 15 percent of the City’s population, and this group is most likely to experience independent living difficulty, followed by cognitive difficulty. Table A-19 reports employment status for persons who are of working age, i.e., between the ages of 16 and 64, and who have a disability. The American community Survey data indicates that most members of this population are employed.
Table A-18 Type of Disabilities by Age Group, 2020
| Type | Total Count | Under 18 years (0-17) | 18-64 years | 65 Years &Older |
|---|---|---|---|---|
| With Hearing-Vision Difficulties | 738 | 7% | 25% | 67% |
| With a Cognitive Difficulty | 609 | 26%* | 47% | 27% |
| With an Ambulatory Difficulty | 641 | 6%* | 41% | 53% |
| With a Self-Care Difficulty | 186 | 24%* | 35% | 41% |
| With an Independent Living Difficulty | 479 | n/a | 66% | 34% |
Source: 2020 ACS Five-Year Estimates, Table S1810
- For cognitive difficulty, ambulatory difficulty, and self-care difficulty, the ‘Population under 18 years’ excludes children under 5 years of age in these measures.
Table A-19 Employment Status for Disabled Persons, 2019
| Employment Status | Working-Age Residents with a Disability (16 to 64 years old) |
|---|---|
| Employed | 164 |
| Not Employed | 54 |
Source: 2019 ACS Five-Year Estimates
3.3.4. PERSONS WITH DEVELOPMENTAL DISABILITIES
Section titled “3.3.4. PERSONS WITH DEVELOPMENTAL DISABILITIES”Senate Bill (SB) 812 requires the City to include the needs of individuals with a developmental disability within the community in the special housing needs analysis. According to Section 4512 of the Welfare and Institutions Code, a ‘developmental disability’ means a disability that originates before an individual attains age 18 years, continues, or can be expected to continue, indefinitely, and constitutes a substantial disability for that individual which includes intellectual disabilities, cerebral palsy, epilepsy, and autism.
Many persons with developmental disabilities can live and work independently in a conventional housing environment. Individuals with more severe disabilities require a group living environment where supervision is provided. The most severely affected individuals may require an institutional environment where medical care and physical therapy are provided. Because developmental disabilities exist before adulthood, the first issue in supportive housing for persons with developmental disabilities is the transition from the person’s living situation as a child to an appropriate level of independence as an adult.
The California Department of Developmental Services (DDS) currently provides community-based services to approximately 243,000 persons with developmental disabilities and their families through a statewide system of 21 regional centers, four developmental centers, and two community-based facilities. The Far Northern Regional Center is one of 21 regional centers in California that provides point of entry to services for persons with developmental disabilities. The center is a private, nonprofit community agency that contracts with local businesses to offer a wide range of services to individuals with developmental disabilities and their families. Table A-20 provides information about Yreka’s population of persons with developmental disabilities and Table A-21 provides information about their place of residence.
Table A-20 Residents with Developmental Disabilities by Age
| Zip Code | 0-17 Years | 18+ Years | Total |
|---|---|---|---|
| 96097 | 58 | 95 | 153 |
Source: Siskiyou County 6th Cycle Housing Element Data Packet, 2019
Table A-21 Residents with Developmental Disabilities by Residence Type
| Zip Code | Community Care | Home Parent/Guardian | Independent Living | Other | Total |
|---|---|---|---|---|---|
| 96097 | 0 | 93 | 57 | <11 | >150 |
Source: Siskiyou County 6th Cycle Housing Element Data Packet, 2019
A number of housing types are appropriate for people living with a development disability: rent-subsidized homes, licensed and unlicensed single-family homes, inclusionary housing, Section 8 vouchers, special programs for home purchase, HUD housing, and SB 962 homes. The design of housing, e.g., accessibility modifications, the proximity to services and transit, and the availability of group living opportunities represent some of the types of considerations that are important in serving this need group. Incorporating barrier-free design in all new multi-family housing (as required by California and federal fair housing laws) is especially important to provide the widest range of choices for disabled residents. Special consideration should also be given to the affordability of housing, as people with disabilities may be living on a fixed income.
In order to assist in the housing needs for persons with developmental disabilities, the City will implement programs to coordinate housing activities and outreach with the Far North Regional Center and encourage housing providers to designate a portion of new affordable housing developments for persons with disabilities, especially persons with developmental disabilities, and pursue funding sources designated for persons with special needs and disabilities. Program HE-6.1.3, carried over from the prior Housing Element (identified as Program HE.2.1.6 in the previous housing element) is intended to specifically address the needs of persons with a developmental disability. To remove regulatory barriers to the development of group homes, Program HE-6.1.4 commits the City to removing the distinction between small and large groups homes in the Medium Density Residential (R-2), High Density Residential (R-3), Commercial Downtown (C-2), and Commercial Highway (CH) zones and permit group care facilities as a by-right use in these zones.
3.3.5. FEMALE-HEADED HOUSEHOLDS
Section titled “3.3.5. FEMALE-HEADED HOUSEHOLDS”Female-headed single-parent households experience numerous housing problems, including affordability (the individuals are often on public assistance), overcrowding (the individuals often cannot afford units large enough to accommodate their families), insufficient housing choices, and discrimination. The City of Yreka recognizes these problems and has included policies and programs in this document to address affordability, overcrowding, and discrimination for all segments of the population.
Table A-22 illustrates the number of family households that are headed by a female with no spouse present. Female-headed households with no spouse present account for 10 percent of all households in the city. Of these households, the majority are renter-occupied. Table A-23 reports the presence of children in female-headed households, as well as poverty indicators for female-headed households. Female-headed households with their own children make up approximately 15 percent of all households in the city and approximately 74 percent of all female-headed households. Female-headed households under the poverty level make up 36 percent of all female-headed households and 7 percent of total city households.
Table A-22 Female Headed Family Household, 2019
| Number | Percentage of Total Households | |
|---|---|---|
| Owner-Occupied (Female Householder) | 162 | 5% |
| Renter-Occupied (Female Householder) | 175 | 5% |
| Total (Female Householder) | 337 | 10% |
| Total City Households | 3,402 | 100% |
Source: 2019 ACS Five-Year Estimates
Table A-23 Female Householders by Children Present and Poverty, 2019
| Householder Type | Number | %of Total Households |
|---|---|---|
| Female-Headed Family Households | 337 | 20 |
| Female Heads with OwnChildren | 248 | 15 |
| Female Heads without OwnChildren | 89 | 5 |
| Total Householders | 1,684 | 100 |
| Female-Headed Householders Under the Poverty Level | 123 | 7 |
| Total families Under the Poverty Level | 413 | 25 |
Source: 2019 ACS Five-Year Estimates
3.3.6. LARGE FAMILIES
Section titled “3.3.6. LARGE FAMILIES”A large family is one with five or more family members. Large families are considered a special needs group because they require larger homes, but don’t necessarily make enough money to afford many of the larger homes available. Those homes may be luxury or newer homes out of the range of affordability for lower-income families. Thus, a large family may struggle to find suitable affordable housing. The number of large families in the city is shown in Table A-24. The proportion of renter households as a percentage of all large households decreased and now makes up the minority of all large family households. Owner-occupied large households now make up approximately 54 percent of all large households.
Table A-24 Large Families (5+ Family Members) by Tenure, 2000-2019
| 2000 | 2000 | 2010 | 2010 | 2019 | 2019 | |
|---|---|---|---|---|---|---|
| Households | %of Total Households | Households | %of Total Households | Households | %of Total Households | |
| Owner-Occupied Large Households | 141 | 5% | 132 | 4% | 139 | 4.1% |
| Renter-Occupied Large Households | 109 | 4% | 214 | 6% | 115 | 3.4% |
| Total Large Households | 250 | 8% | 346 | 10% | 254 | 7.5% |
| Total Households | 3,103 | 100% | 3,394 | 100% | 3402 | 100.0% |
Source: 2000 US Census, 2010 US Census, 2019 ACS Five-Year Estimates
3.3.7. INDIVIDUALS AND FAMILIES EXPERIENCING HOMELESSNESS
Section titled “3.3.7. INDIVIDUALS AND FAMILIES EXPERIENCING HOMELESSNESS”Individuals and families may find themselves homeless for a variety of economic, social and/or personal reasons. Their homelessness can be a temporary or semi-permanent living situation. Each situation in which people become homeless is different, requiring different housing needs. Regardless of the cause, the most immediate housing needs can be satisfied with three basic shelter types: emergency, transitional and temporary. Since the last Housing Element, the number of residents experiencing homelessness in the City has visibly increased. According to the 2022 Community Health Needs Assessment for Siskiyou county the rate of homelessness, i.e., the number of homeless individuals per 100,000 population, of Siskiyou county is greater than California: 490.7 individuals for Siskiyou county to California’s 411.2 individuals (prepared by Dignity Health Mercy Medical Center Mt. Shasta, Fairchild medical Center, and Siskiyou County Public Health Department, pg. 45) is prepared The NorCal Continuum of Care (CoC) is a seven-county homeless consortium and is charged by the US Department of Housing and Urban Development (HUD) to conduct a Point In Time (PIT) Count annually. The PIT Count results in data that helps communities to prioritize those most vulnerable and chronically homeless for different types of shelter and housing. Point In Time Counts are reported at the county level. A PIT Count counts both sheltered and unsheltered individuals. The 2020 PIT County for Siskiyou county found there were 274 unsheltered individuals and 37 shelter individuals.
In 2021 HUD provided the CoC a waiver from conducting the unsheltered count due to COVID-19. The CoC’s 2021 PIT count found there were 214 sheltered residents in Siskiyou County. This is an increase of 177 individuals experiencing homelessness over 2020. Because the CoC counted only persons/households residing in a privately or publicly operated shelter in 2021 it is anticipated the 2021 PIT Count undercounts the number of persons experiencing homelessness in Siskiyou county. Table A-24 below provides the available racial and ethnic composition data from the 2020 and 2021 PIT counts.
Table A-25 Racial and Ethnic Information, 2020 and 2021 PIT Counts, Service Area of Norcal Continuum of Care
| 2020 | 2020 | 2021 | 2021 | |
|---|---|---|---|---|
| %ofUnsheltered | Total Persons | %ofUnsheltered | Total Persons | |
| White | 71.70% | 733 | 79% | 624 |
| Black or African American | 3.10% | 32 | 4% | 29 |
| American Indian/Alaskan Native | 10.80% | 110 | 17% | 133 |
| Native Hawaiian/Other Pacific Islander | 1.40% | 14 | 1.5% | 11 |
| Asian | 1.00% | 10 | 1% | 7 |
| Multiple Races | 7.30% | 75 | n/a | |
| Did Not Respond | 4.80% | 49 | 38% | 75 |
| Refused | n/a | 1.5% | 13 | |
| Hispanic/Latino | 9.70% | 99 | 13% | 103 |
| Non-Hispanic/Latino | 84.80% | 867 | 82% | 652 |
| Did Not Respond | 5.60% | 57 | 2% | 15 |
| Don’t Know | n/a | 1% | 7 |
Table A-26 Gender Information, 2020 and 2021 PIT Counts for Siskiyou County
| 2020 Total Persons | 2021 Total Persons | |
|---|---|---|
| Male | 208 | 100 |
| Female | 95 | 112 |
| Gender Non-Conforming | 4 | 0 |
| Trans | 2 | 0 |
| Did Not Respond | 2 | 2 |
| Refused | n/a | 0 |
| Total | 311 | 214 |
| Sheltered | 37 | 214 |
| Unsheltered | 274 | n/a |
With respect to age, 32 children under the age of 18 were counted, and in 2021, 148 children were counted, a nearly five-fold increase in children experiencing homelessness. Additional demographic data is presented in Table A-26 meet the needs of those experiencing chronic homelessness and disabilities.
Another housing need is
Table A-27 Additional Demographics, 2020 and 2021 PIT Counts for Siskiyou County
| Additional Demographics | 2020 Total Persons | 2021 Total Persons |
|---|---|---|
| Chronically Homeless | 92 | 18 |
| Families | 24 | 22 |
| Mental Disability | not reported | 46 |
| Physical Disability | not reported | 27 |
| Developmental Disability | not reported | 4 |
Altogether the data indicate both men and women are experiencing homelessness. While the number of families counted remained similar from 2020 to 2021, 24 and 22, respectively, the number of homeless children increased significantly. Whites alone are experiencing the highest rates of homelessness as a racial and ethnic group. Several stakeholders remarked some individuals and households are experiencing homelessness because they have been displaced from their homes by the recent state wildfires in Siskiyou county and the larger region, and the slow and costly rebuilding process.
Although an official Yreka-specific count does not exist, the City notes there has been an observable increase in the number of residents experiencing homelessness. There is an unsanctioned camp located in the vicinity of the College of the Siskiyous and Siskiyou County behavior health services, all of which are within city limits. A May 2022, tent survey conducted by members of the CoC indicates there are approximately 22 camps at this location. The compiled information indicates there are approximately 25 residents in this camp. Camp residents were interviewed, on a voluntary basis, and the following is a list of the most needed and requested items:
- Water for drinking/cooking, personal sanitation, flush toilets, and fire safety
- Trash pickup: more bags, a dumpster placed nearby, and more community help for cleaning up abandoned camp sites.
- Safe fire area for community cooking and hot water
- Police protection: tents cannot be left because outsiders invade the community.
- Mail access: a nearby place the community can receive and send mail
- ID help needed for jobs, medical and social services.
- Small house: similar to Medford’s mini homes to move into in the future.
Services for individuals and families experiencing homelessness are available in the city and elsewhere in the county. Yreka delegated the entirety of their 5-year allocation of Permanent Local Housing Allocation to the County. The County is allocating a portion of the PLHA formula funding to convert an existing structure to a low barrier shelter that is anticipated to open fall or winter 2023. PLHA funding is also providing financial support for a project sponsored by a local youth homeless program for the conversion of office space to a three room family shelter. Table A-28 below outlines the programs in the City and surrounding area that offer assistance.
Clearly there is a need for housing that is available and affordable to people and families who are experiencing homelessness. While emergency shelters provide temporary shelter and safe place to be, they do not provide a long term solution. Overall addressing the housing needs of this special population requires a variety of housing types that is assured to be affordable, mostly by way of government subsidies, such as housing choice vouchers. There are examples of sanctioned communities that employ more affordable housing forms, such as tiny houses, to meet the housing needs of those experiencing homelessness. Permanent supportive housing is needed to meet the needs of those experiencing chronic homelessness and disabilities. Another housing need is accessibility: according to the 2021 PIT, of those experiencing homelessness, approximately 36 percent had one or more disability which speaks to a need for PSH and group homes. Given the number of families and young children experiencing homelessness, housing is affordable for this target population, is configured for families, and is located close to schools is critical. Universally, housing for this target population needs to be located close, e.g., no more than a quarter of a mile, from a transit stop, essential services such as a full grocery store, pharmacy, etc.
Table A-28
Homelessness Services
Section titled “Homelessness Services”| AgencyName | Address | City | Services |
|---|---|---|---|
| SiskiyouCountyDomesticViolence&Crisis Center | 118RanchLane | Yreka | 1, 4, 6, 7, 9 |
| LaneStreet Effort | 417 LaneStreet | Yreka | 6, 7, 8 |
| Barker’sBoardandCare | 200 S. 4 th Street | Montague | 8 |
| NorthernValleyCatholic Social Services | 1515 S. OregonStreet | Yreka | 1, 3, 10 |
| SiskiyouCountyBehavioralHealthDepartment | 2060CampusDrive | Yreka | 1, 2, 3, 4, 5, 12, 14, 15, 16, 17 |
| CaliforniaDepartmentofRehabilitation | 1288 S. MainStreet | Yreka | 11 |
| WorkforceConnection | 310 Boles Street | Weed | 11 |
| SiskiyouTrainingandEmploymentProgram | 310 Boles Street | Weed | 11 |
| YrekaFamilyResourceCenter | 201 S.BroadwayStreet | Yreka | 2, 3, 6, 7, 8, 10,18 |
| WIC | 1217 S. MainStreet | Yreka | 10 |
| SalvationArmy | 501 N.MainStreet | Yreka | 9, 10 |
| Veteran’sAdministration | 311 LaneStreet | Yreka | 8, 13 |
| GreenhornGrange | 300RanchLane | Yreka | 10 |
| St. Joseph’s CatholicChurch Hall | 314 Fourth Street | Yreka | 10 |
| YrekaDreamCenterFoodCloset | 900 North Street | Yreka | 10 |
| Great Northern Services | 310 Boles Street | Weed | 10 |
| Siskiyou County Women, Infant, &Children | 700 S Main Street | Yreka | 10, 18 |
| Siskiyou Food Assistance | 776 S Davis Avenue | Weed | 10, 15 |
| Klamath Falls Gospel Mission | 1931 Mission Avenue | Klamath Falls,OR | 5, 7, 8, 10 |
| Klamath Lake County Food Bank | 3231 Maywood Drive | Klamath Falls,OR | 10 |
| Tulelake-Newell Family Center | 810 Main Street | Tulelake | 18 |
| Klamath &Lake Community Action Services | 2316 S Sixth Street, Suite C | Klamath Falls,OR | 14, 15, 17, 18 |
| Klamath Advocacy Center | 142 Riverside Drive | Klamath Falls,OR | 3, 6 |
| Disabled American Veterans | 2809 Avalon Street | Klamath Falls,OR | 13, 18 |
| Exodus House | 303 Washington Street | Klamath Falls,OR | 3, 7, 14 |
| Table 28 (cont’d) ServiceCodes | Table 28 (cont’d) ServiceCodes |
|---|---|
| 1. AdultCounseling 2. AngerManagementClasses 3. Counseling,Education,&Prevention 4. CrisisIntervention 5. Drug&AlcoholTreatment 6. EmergencyAssistanceForBatteredWomen 7. EmergencyHousingforWomen&Children 8. EmergencyHousingForMen 9. Emergency,Transportation (e.g., busticket) | 10. FoodorClothingReferral 11. JobTraining 12. Treatment &HousingofMentallyIll 13. VeteransAssistance 14. IndependentLivingSkills Training 15. FoodStamps,CalWorks,GeneralRelief 16. DayTreatment 17. Workshops 18. Family Services |
Source: City of Yreka
3.3.8. FARMWORKERS
Section titled “3.3.8. FARMWORKERS”Yreka is a low density rural community. There are no farmed areas within the City nor are there agricultural areas adjacent to the City. According to California Farm Bureau (https://www.cfbf.com/about-the-farmbureau/counties/, accessed January 3, 2023), the top crops in Siskiyou county are cattle, vegetables, strawberries, timber, and alfalfa hay. Closer to Yreka, the agricultural uses are primarily ranching with little need for seasonal farmworkers. According to representatives of the Modoc-Siskiyou Community Action Agency, silvicultural workers are mostly found in those Siskiyou County communities that are closer to planting sites. The nearest community employing seasonal farmworkers is Macdoel, which is approximately 50 miles east of Yreka. This is the closest area where intensive farming of strawberry and potato crops occurs. Intensive farming of this nature does not occur within Yreka’s city limits. Soils in the Yreka area are considered to be too heavy for regular tillage, so they are used almost entirely for hay and pasture. Permanent farmworkers are paid wages similar to other skilled and semi-skilled workers in the region and need not be considered separately.
Farmworkers are defined as those households whose wage-earners make their living through permanent or seasonal agricultural work. Farmworker households may move with the seasons to different farming communities, or those who find tree planting jobs and who also move throughout the forested regions on a seasonal basis. Farmworker households may permanently reside in a community. According to the 2017 U.S. Department of Agriculture Census, it is estimated there were nearly 4,000 farmworkers in Siskiyou county. Of those, approximately 34 percent worked 150 days or more at the same farm, whereas 66 percent worked less than 150 days on the same farm. This data suggests a majority of farmworkers are seasonal and are working on larger farms. The 2000 US Census (the most recent reliable source for this data), reported only 14 farmworkers living in the city at the time. Because Yreka is the seat of Siskiyou County government and many essential services and public amenities are located in Yreka, it is anticipated the number of farmworker households who reside in Yreka has increased since 2000.
Table A-29 Hired Farm Labor - State of California and Siskiyou County
| Farms | Hired Workers | $1,000 payroll | |
|---|---|---|---|
| California | 30,421 | 377,593 | 6,978,923 |
| Siskiyou County | 217 | 3,949 | 45,640 |
Source: USDA Census of Farmworkers 2017
Table A-30 Farmworkers by Days Worked-State of California and Siskiyou County
| California | Siskiyou Co. | ||
|---|---|---|---|
| 150 Days or More | Farms [All] | 18,439 | 124 |
| Workers [All] | 187,875 | 1,009 | |
| Farms with 10 or More Workers | |||
| Farms | 3,481 | 15 | |
| Workers | 146,791 | 714 | |
| Fewer than 150 Days | Farms [All] | 20,505 | 142 |
| Workers [All] | 189,718 | 2,940 | |
| Farms with 10 or More Workers | |||
| Farms | 3,298 | 13 | |
| Workers | 146,715 | 2,664 |
Source: USDA Census of Farmworkers 2017
The City was unable to locate Yreka-specific demographic data of farmworkers. Figure 3.A provides a demographic summary of key characteristics of California Farmworkers based on 2009-2011 American Community Survey data. Farmworkers in California:
- Are more likely to be men
- Between the ages of 25 and 44
- Over 80 percent are Hispanic/Latino
- Are not a citizen
- Have less than a high school education
- Live below the poverty line, with a majority living 200 percent below the poverty line
- Do not have health insurance
Figure 3.A
Percentage of Farmworkers
40
60
80
100
Women
Men
The 2019-2020 Findings from the National Agricultural Workers Survey (NAWS) provides some demographic insights that point to farmworker housing needs (https://www.dol.gov/sites/dolgov/files/ETA/naws/pdfs/ NAWS%20Research%20Report% 2016.pdf, accessed January 3, 2023). The NAWS was prepared for the U.S Department of Labor, Employment and Training Administration. The preparers conducted field interviews of 2,172 U.S. farmworkers.
Less than High School
- Seventy-eight percent of all farmworkers were Hispanic. Among U.S.-born workers, 32% were Hispanic.
- Thirty-three percent of farmworkers self-identified as White, fewer than 1% as Black or African American, and 66% of respondents did not select a category; instead, they described race with an open-ended ‘other’ response. amounts of sampling error.
- Ten percent of farmworkers were identified as indigenous.
- Most farmworkers were settled workers (85%). 15 percent were migrants.
- Sixty-six percent of interviewed farmworkers were men.
- Farmworkers’ average age was 41, and median age was 39.
- 57 percent of all farmworkers were married.
- 50 percent of all farmworkers had children.
- Thirty-eight percent of farmworkers were living apart from all nuclear family members at the time of their interview. 66% of unaccompanied farmworkers were single workers without children, 14% were parents, and 10% had a spouse but no children.
- Approximately 62% of surveyed farmworkers reported that Spanish is their primary language.
- Thirty-two percent of workers reported that they could speak English ‘well,’ and 29% said, ‘not at all.’ 31% reported that they could read English ‘well’; 40% said, ‘not at all.’
- The average level of formal education completed by farmworkers was ninth grade.
- Average hourly wage for all farmworkers: $13.59.
Altogether these data indicate farmworker housing needs to be affordable to extremely low and very low income households. Housing configurations for families and group living situations are needed. Farmworker housing needs to be located near schools and employment opportunities for spouses. Also, the data indicates a need for the dissemination of fair housing materials with being made available in Spanish, and proactive outreach to the farmworker community. There are two general categories of farmworker housing:
- If the housing is provided by the Employer: Living quarters in urban or rural areas provided by an employer in connection with any work (including agricultural work), whether or not rent is involved. HSC 17008(a) applies.
Figure 3.A
Section titled “Figure 3.A”Source: Farmworkers in California: A Brief Introduction, Latino Caucus, October 2013.
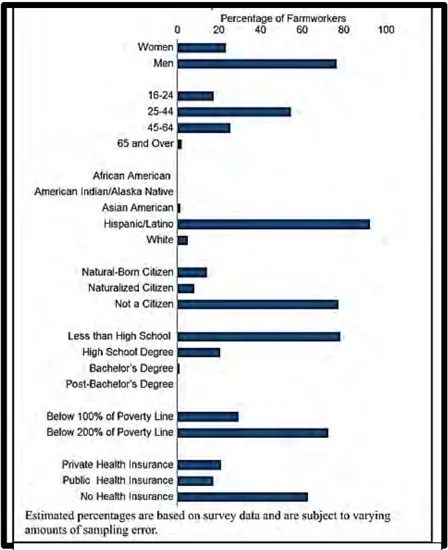
Figure 3: Housing Unit Mix
- If the housing in not provided by the Employer: Living quarters that house agricultural workers employed by an agricultural employer(s), and meet some other requirements. HSC 17008(b) applies. This second type of employee housing is outside the scope of this document. See the state’s rules for additional licensing requirements.
The Yreka Municipal Code permits permanent employee housing, inclusive of farmworker housing, in all residential zones subject to the same standards.
The City Zoning Ordinance was updated in 2014 to comply with the state Employee Housing Act that ensures local zoning can accommodate employee housing for farmworkers and other employees. Program HE-3.1.1 commits the City to actions to affirmatively further fair housing. The actions, detailed in Table B-1 in Appendix B, include preparation of fair housing materials including preparing materials in Spanish language, and proactive outreach by City representatives attending of community events to answer questions and improve awareness. Program HE-6.1.5 obligates the City to regularly monitor State law for changes in the legal requirements.
3.4. HOUSING COMPOSITION
Section titled “3.4. HOUSING COMPOSITION”The composition of housing units in Yreka is mostly single-family. Table A-31 displays the estimated number of each type of housing unit for 2010, 2013, and 2021 as reported by the DOF. There has been very little change of housing unit types since 2010. Between 2010 and 2021, most of the housing unit growth was the result of increased single-family detached units. The actual number of units issued building permits for new construction between 2015 and 2021 was 11 single-family and no multi-family.
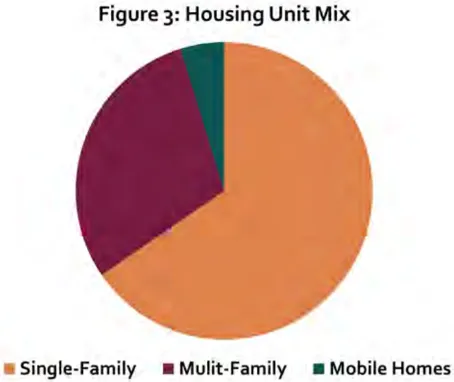
Table A-31 Housing Unit Types, 2010-2021
| 2011 | 2011 | 2013 | 2013 | 2021 | 2021 | |
|---|---|---|---|---|---|---|
| Units | Percentage | Units | Percentage | Units | Percentage | |
| Single-Family | ||||||
| Detached | 2,239 | 61% | 2,237 | 61% | 2,266 | 61% |
| Attached | 159 | 4% | 159 | 4% | 159 | 4% |
| Multi-Family | ||||||
| 2-4 units | 449 | 12% | 449 | 12% | 449 | 12% |
| 5 or more | 656 | 18% | 656 | 18% | 656 | 18% |
| Mobile Homes | 172 | 5% | 172 | 5% | 176 | 5% |
| Total Units | 3,675 | 100% | 3,673 | 100% | 3,706 | 100% |
Source: Department of Finance Population and Housing Estimates 2011 - 2021 Table E-5
3.5. HOUSING CONDITIONS
Section titled “3.5. HOUSING CONDITIONS”3.5.1. AGE OF HOUSING STOCK
Section titled “3.5.1. AGE OF HOUSING STOCK”Housing element law requires an estimate of substandard housing in the community. Determining the percentage of units built prior to 1970 provides an estimate of major rehabilitation or replacement need. Table A-32 indicates that over 40 percent of the units in the city were constructed prior to 1970. Therefore, based on age alone, it would appear that approximately 40 percent of homes in the city may require rehabilitation or replacement, depending on the level of maintenance these units have received. However, at the time of the City’s 2013 Housing Condition Survey (detailed below), only 41 units, or just over 9 percent of surveyed units, were identified as needing more than minor repairs. It is important to note that the survey did not include mobile home parks and was performed as a ‘windshield survey.’ Inclusion of the mobile home parks and closer inspection could result in an increase in the number of units requiring rehabilitation or replacement.
Table A-32 Age of Housing Units
| Year Built | Housing Units | Percentage of Total |
|---|---|---|
| Built 1939 or earlier | 435 | 11.9% |
| Built 1940 to 1949 | 184 | 5.0% |
| Built 1950 to 1959 | 544 | 14.9% |
| Built 1960 to 1969 | 354 | 9.7% |
| Built 1970 to 1979 | 784 | 21.4% |
| Built 1980 to 1989 | 609 | 16.6% |
| Built 1990 to 1999 | 339 | 9.3% |
| Built 2000 to 2009 | 256 | 7.0% |
| Built 2010 to 2013 | 148 | 4.0% |
| Built 2014 or later | 8 | 0.2% |
| Total | 3,661 | 100% |
Source: 2019 ACS Five-Year Estimates
3.5.2. OCCUPANCY AND TENURE
Section titled “3.5.2. OCCUPANCY AND TENURE”Table A-33 and Table A-34 illustrate the tenure and occupancy of housing in Yreka. The most recent tenure information comes from the 2020 US Census ACS. According to this information, the majority of households are owner-occupied (more than 59 percent). The data also indicate the average household size is slightly larger for renter-occupied units. Table A-34 presents occupancy information from the Census Bureau for 2000, 2010, and 2019. The number of housing units increased by 358 between 2000 and 2019. The vacancy rate increased slightly during this period from approximately 6 to 7 percent.
Table A-33 Housing Units by Tenure, 2020
| Tenure | Units | Percentage | Average Household Size |
|---|---|---|---|
| Owner-Occupied | 2,026 | 59.5% | 2.15 |
| Renter-Occupied | 1,381 | 40.5% | 2.31 |
| Total Occupied Housing Units | 3,407 | 100% |
Source: 2020 ACS Five-Year Estimates
Table A-34 Occupancy Status, 2000-2019
| 2000 | 2000 | 2010 | 2010 | 2019 | 2019 | |
|---|---|---|---|---|---|---|
| Occupancy | Units | Percentage | Units | Percentage | Units | Percentage |
| Total Occupied Housing Units | 3,114 | 94% | 3,394 | 92% | 3,402 | 92.9% |
| Total Vacant Housing Units | 189 | 6% | 281 | 8% | 259 | 7.1% |
| For Rent | 85 | 3% | 119 | 3% | 55 | 1.5% |
| For Sale Only | 33 | 1% | 43 | 1% | 0 | 0.0% |
| Rented or Sold, Not Occupied | 16 | 0% | 20 | 1% | 18 | 0.5% |
| For Seasonal, Recreational, or Occasional Use | 21 | 1% | 30 | 1% | 69 | 1.9% |
| All Other Vacant | 34 | 1% | 69 | 2% | 117 | 3.2% |
| Total Housing Units | 3,303 | 100% | 3,675 | 100% | 3,661 | 100% |
Source: 2000 US Census, Table H005; Siskiyou County 5th Cycle Housing Element Data Packet, 2013, ACS 2019
3.5.3. HOUSING CONDITIONS SURVEY
Section titled “3.5.3. HOUSING CONDITIONS SURVEY”In June 2013, the City of Yreka conducted a windshield survey of housing conditions in the community. Of the 3,673 units in Yreka, 444, or 12 percent, were surveyed. The condition of housing was assessed by an exterior survey of the quality and condition of the building and what improvements (if any) were needed. Each structure was scored according to criteria established by HCD in five categories: foundation, roofing, siding, windows, and electrical. Based on scores assigned to the five categories, each structure was classified as being in sound or dilapidated condition, or in need of minor, moderate, or substantial repairs (as defined in Table A-35). The survey did not assess interior conditions.
Table A-35 Definition of Housing Conditions and 2013 Survey Results
| Condition | Number of Units Surveyed | % | |
|---|---|---|---|
| Sound | Abuilding that appearsneworwellmaintainedand structurally intact. Thefoundationshouldappear structurally undamagedandthereshould be straight roof lines. Siding, windows, anddoorsshould be ingood repairwithgood exterior paint condition. Minor problems such as small areas of peeling paint and/or other maintenance items are allowableunderthis category. | 309 | 70% |
| Minor | Abuilding that showssigns of deferred maintenance or which only needs repair or replacement of one majorcomponent, such as a roof. | 94 | 21% |
| Moderate | Abuilding inneedof replacement of oneormoremajor components andother repairs, such as roof replacement, painting,andwindow repairs. | 35 | 8% |
| Substantial | Abuilding that requires replacement of several major systems and possibly other repairs, such as complete foundation work, roof structure replacementandre-roofing,painting,and window replacement. | 2 | <1% |
| Dilapidated | Abuilding sufferingfromextensive neglect, whichappears structurally unsoundandmaintenanceis nonexistent, is not fit forhuman habitation in its current condition,maybe considered for demolition, or major rehabilitation willbe required at a minimum. | 4 | <1% |
Of the units surveyed, 70 percent (309 units) were in sound condition, with the remaining 30 percent (135 units) requiring at least some repairs. Of the surveyed units, 21 percent (94 units) needed only minor repairs, with 8 percent (35 units) requiring moderate repairs. Two units surveyed needed substantial repairs, and four were considered dilapidated. If the units surveyed are a representative sample of housing units in Yreka, it means that of the community’s 3,673 units, 2,556 (70 percent) are in sound condition, 778 (21 percent) need only minor repairs, 290 (8 percent) housing units require moderate repairs, 17 (less than 1 percent) are in need of substantial repairs, and 33 (less than 1 percent) are considered dilapidated.
The City is in the process of updating its 2013 housing conditions survey. The preliminary results indicate housing conditions are similar as previously reported, although in neighborhoods of lower economic resources staff is observing occurrences that conditions have further degraded due to more limited financial resources to repair housing coupled with recent material and labor cost increases for home repair and maintenance. Given nearly 60 percent of the City’s housing stock is owner-occupied, securing funding for an owner-occupied rehab program would be one approach to make low-cost funding available to lower income residents who may not be able to afford housing repairs to improve the condition of their home. The HOME program is one funding source that when there are more than 1.5 persons per room. Table A-37 and Table A-30 illustrate the number ana percentage allows funds to be used for this type of activity. Program HE-4.3.1 commits the City to pursuing funding during the planning period for an owner-occupied rehabilitation program to develop a financial resource that enables qualified homeowners to improve the condition of their residence. One component of Program HE-4.3.1 includes identifying any concentrations of substandard housing. The results of the survey will be used to prioritize rehabilitation funding. The results of updated housing conditions survey and ongoing economic conditions also suggest the need to continue Program HE.3.1.3 from the previous housing element. Program HE.3.1.3 prioritizes code enforcement has been carried forward as part of this housing element and is identified as Program HE-4.3.2.
3.5.4. HOUSEHOLD SIZE
Section titled “3.5.4. HOUSEHOLD SIZE”Household size by tenure for 2000, 2010 and 2019 is shown in Table A-36. In 2000 and 2010, the majority of owner-occupied households were inhabited by two residents, but more recently a higher proportion exists for single-occupancy households. Renter-occupied households were mostly inhabited by one resident since 2000. Although the absolute number of households changed for each category between 2000 and 2019, the proportion of each category remained relatively static, with the largest changing category being single-person owneroccupied housing increasing from 16 to 22 percent between 2010 and 2019.
Table A-36 Household Size by Tenure, 2000-2019
| 2000 | 2000 | 2010 | 2010 | 2019 | 2019 | |
|---|---|---|---|---|---|---|
| Households | Percentage | Households | Percentage | Households | Percentage | |
| Owner-Occupied | ||||||
| 1 person | 523 | 17% | 550 | 16% | 759 | 22% |
| 2 persons | 728 | 23% | 727 | 21% | 704 | 21% |
| 3 persons | 227 | 7% | 206 | 6% | 237 | 7% |
| 4 persons | 188 | 6% | 149 | 4% | 159 | 5% |
| 5 persons | 110 | 4% | 72 | 2% | 94 | 3% |
| 6 persons | 25 | 1% | 26 | 1% | 45 | 1% |
| 7 or more persons | 6 | 0% | 21 | 1% | 0 | 0% |
| Renter-Occupied | ||||||
| 1 person | 521 | 17% | 652 | 19% | 657 | 19% |
| 2 persons | 312 | 10% | 387 | 11% | 301 | 9% |
| 3 persons | 221 | 7% | 269 | 8% | 178 | 5% |
| 4 persons | 133 | 4% | 179 | 5% | 153 | 4% |
| 5 persons | 49 | 2% | 93 | 3% | 70 | 2% |
| 6 persons | 13 | <1% | 44 | 1% | 42 | 1% |
| 7 or more persons | 47 | 2% | 19 | 1% | 3 | 0% |
| Total | 3,103 | 100% | 3,394 | 100% | 3,402 | 100% |
Source: 2000 US Census, 2010 US Census, 2019 ACS Five-Year Estimates
3.5.5. OVERCROWDED HOUSING
Section titled “3.5.5. OVERCROWDED HOUSING”The US Census Bureau defines overcrowding as more than 1.01 persons per room. Severe overcrowding occurs when there are more than 1.5 persons per room. Table A-37 and Table A-38 illustrate the number and percentage of units in the city according to occupants per room. Less than 1 percent of owner-occupied housing units and less than 2 percent of renter-occupied units were either overcrowded or severely overcrowded in 2019. Although there are some households experiencing overcrowding, these numbers show that both overcrowding and severe overcrowding does not appear to be an issue in the city.
Table A-37 Overcrowded Housing, 2000 and 2019
| 2000 | 2000 | 2019 | 2019 | |
|---|---|---|---|---|
| Households | Percentage | Households | Percentage | |
| Owner-Occupied Total | 1,817 | 58.4% | 1,998 | 58.7% |
| 0.50 or less occupants per room | 1,420 | 45.6% | 1,367 | 40.2% |
| 0.51 to 1.00 occupants per room | 371 | 11.9% | 607 | 17.8% |
| 1.01 to 1.50 occupants per room | 26 | 0.8% | 11 | 0.3% |
| 1.51 to 2.00 occupants per room | 0 | 0% | 0 | 0.0% |
| 2.01 or more occupants per room | 0 | 0% | 13 | 0.4% |
| Renter-Occupied Total | 1,296 | 41.6% | 1,404 | 41.3% |
| 0.50 or less occupants per room | 757 | 24.3% | 784 | 23.0% |
| 0.51 to 1.00 occupants per room | 442 | 14.2% | 569 | 16.7% |
| 1.01 to 1.50 occupants per room | 69 | 2.2% | 41 | 1.2% |
| 1.51 to 2.00 occupants per room | 8 | 0.3% | 10 | 0.3% |
| 2.01 or more occupants per room | 20 | 0.6% | 0 | 0.0% |
Source: 2000 US Census, 2019 ACS Five-Year Estimates
Table A-38 Overcrowded Housing Summary, 2019
| Overcrowded Type | Households |
|---|---|
| Total Overcrowded (1.01 or more) | 75 |
| Owner-Occupied | 24 |
| Renter-Occupied | 51 |
| Total Severely Overcrowded (1.5 or more) | 23 |
| Owner-Occupied | 13 |
| Renter-Occupied | 10 |
Source: 2019 ACS Five-Year Estimates
3.6. HOUSING COSTS
Section titled “3.6. HOUSING COSTS”3.6.1. OWNER OCCUPIED HOUSING
Section titled “3.6.1. OWNER OCCUPIED HOUSING”Table A-39 presents the housing value for owner-occupied homes in the city. Despite the high cost of housing, the majority of homes (54 percent) were valued below $150,000 in 2019.
Table A-39 Owner-Occupied Housing Unit Value, 2019
| Value | Number of Homes | Percentage of Homes |
|---|---|---|
| $0 to $49,999 | 229 | 14% |
| $50,000 to $99,999 | 183 | 11% |
| $100,000 to $149,999 | 492 | 29% |
| $150,000 to $199,999 | 580 | 34% |
| $200,000 to $249,999 | 151 | 9% |
| $250,000 to $299,999 | 147 | 9% |
| $300,000 to $499,999 | 178 | 11% |
| $500,000 and up | 38 | 2% |
| Total | 1,998 | 100% |
Source: 2019 ACS Five-Year Estimates
Housing cost information is supplemented by Table A-40, which notes that the median home sales price in October 2020 was approximately $286,000 and in October 2021 was approximately $330,000. There was a substantial home value increase between 2020 and 2021 of almost $44,000, which mirrors state trends. According to California Association of Realtors prices rose by almost $15,000 in one month from September to October, 2021.
A household can typically qualify to purchase a home that is two and one-half to three times its annual income, depending on the down payment, the level of other long-term obligations (such as a car and/or student loan), and interest rates. In practice, the interaction of these factors allows some households to qualify for homes priced at more than three times their annual income, while other households may be limited to purchasing homes no more than two times their annual income. With prices this high, the median home price in Yreka is not affordable to any group less than above moderate income (>$42,483).
Table A-40 Median Home Sales Price, 2000 and 2021
| Oct-20 1 | Sep-21 1 | Oct-21 1 | Income to Afford 2021 Median HomePrice 1 | |
|---|---|---|---|---|
| Siskiyou County | $286,000 | $315,000 | $329,500 | $72,406 |
1 Source: California Association of Realtors 2021, October Home Sales and Price Report, https://www.car.org/aboutus/mediacenter/newsreleases/2021releases/oct2021sales
The City used the California Association of Realtors traditional method to estimate the minimum income needed to afford a median priced home (as of 2021) presented in Table A-40. The $72,406 minimum needed income is based on the following assumptions for a traditional mortgage:
- a 20 percent down payment ($65,900.00),
- an interest rate of 5.1 percent (as per https://www.mortgagecalculator.org on September 8, 2022),
- property taxes are 1 percent of median price ($3,295),
- homeowner’s insurance is 0.38 percent ($1,252) of median price,
- loan applicants have excellent credit scores.
- monthly PITI cannot exceed 30 percent of the household’s gross income.
The qualifying income for the average sales price of a home would require an approximate income of $72,406, which based on the 2022 HCD income limits, is affordable to a Yreka household of four earning the median of $80,300. However, it would be outreach financially for smaller households and householders that earn less than the Siskiyou county median income.
3.6.2. RENTAL HOUSING
Section titled “3.6.2. RENTAL HOUSING”Table A-41 shows the available apartments and houses for rent in Yreka during a point-in-time survey taken in January 2022. There were no four-bedroom apartment or house rentals advertised inside the city. According to HUD data, as of April 2021, there are 97 Housing Choice Vouchers (HCV), which represent 5.90 (average) of renter occupied housing units in Yreka and the immediate adjacent unincorporated area. HCV are a federal program that assists very low-income families, the elderly, and the disabled in obtaining decent, safe, and sanitary housing in the private market. Public Housing Authorities (PHAs) receive federal funds from HUD to administer the voucher program, and housing subsidies are paid to the landlord directly by the PHA on behalf of the participating family. The voucher recipient remains responsible for paying any difference that exists between the actual rent charged by the landlord and the amount subsidized by the program. HCV are being used across almost the entire City. The 2021 data indicates that HCV are not being used in the neighborhoods at the western edge of the city, and the neighborhood south Greenhorn Road and south of the convergence of State Highway 3 and Interstate 5.
Table A-41 Apartment and House Rentals, January 2022
| Bedroom Type | Number of Units Surveyed | Rent Range |
|---|---|---|
| Studio | 1 | $925 |
| One Bedroom | 5 | $600-$800 |
| TwoBedroom | 3 | $756-$1,500 |
| Three Bedroom | 3 | $862-$1,250 |
Sources: Apartmentsguide.com, Craigslist, Rent.com January 2022.
3.6.3. MOBILE HOUSING
Section titled “3.6.3. MOBILE HOUSING”The Department of Finance’s 2021 Estimate of Population and Housing shows a total of 176 mobile homes in Yreka, which represents 5 percent of the total housing stock. A June 2022 search on mobile home sale and rental pricing yielded $1,175 per month for a long term rental at Yreka RV Park. According to a Realtor.com search, on June 29, 2022, there are two manufactured homes for sale in Yreka. Both homes are located in an existing park at 400 Hiram Page Road:
- $20,000: 1,440 sq. ft. 2 bedroom, two bath home
- $34,900: 800 sq. ft. 2 bedroom, one bath home
3.6.4. OVERPAYMENT
Section titled “3.6.4. OVERPAYMENT”Definitions of housing affordability can vary, but in general a household should pay no more than 30 percent of its monthly income on housing costs. Households that pay more than this are considered ‘cost-burdened’ and households that pay more than 50 percent are considered ‘severely cost- burdened.’ Measuring the number of households paying more than these percentages helps define an area’s affordability problem. Overpayment data for all Yreka households by tenure is reported by the 2015-2019 ACS Five-Year Estimates. Table A-42 provides this information for each income category as well as for all households with lower incomes (extremely low, very low and low-income households). Approximately 83 percent of households earning 30 percent or less of the area mean income (AMI) spent more than 30 percent of their income on housing costs; approximately 72 percent of households earning between 30 and 50 percent AMI were also burdened by the cost of housing. Renter households experienced a much higher rate of overpayment than owner households at lower incomes.
Table A-42 Cost Burdens for All Households, 2019
| Household | Extremely Low (30% or less of AMI) | Very Low (> 30% to 50% AMI) | Low (> 50% to 80%AMI) | Moderate (> 80%to 120% AMI) | Above Moderate (> 120% AMI) | Total Households | Lower Income Households (80% or less of AMI) |
|---|---|---|---|---|---|---|---|
| Tl. Ownership Households | 195 | 190 | 435 | 135 | 930 | 1,885 | 820 |
| Overpaying Owner Households | 155 | 110 | 145 | 35 | 25 | 470 | 410 |
| %of Overpaying Owners | 79.5% | 57.9% | 33.3% | 25.9% | 2.7% | 24.9% | 50% |
| Tl. Renter Households | 390 | 365 | 380 | 120 | 260 | 1,515 | 1,135 |
| Overpaying Renter Households | 330 | 290 | 215 | 10 | 15 | 860 | 835 |
| %of Overpaying Renters | 84.6% | 79.5% | 56.6% | 8.3% | 5.8% | 56.8% | 74% |
| Total Households | 585 | 555 | 815 | 255 | 1190 | 3,400 | 1,955 |
| Total Overpaying Households | 485 | 400 | 360 | 45 | 40 | 1,330 | 1,245 |
| %ofTotal Overpaying Households | 82.9% | 72.1% | 44.2% | 17.6% | 3.4% | 39.1% | 64% |
Source: 2019 ACS Five-Year Estimates
The US Department of Housing and Urban Development’s Comprehensive Housing Affordability Strategies (CHAS) database reports on households with housing problems including the lack of a kitchen, the lack of complete plumbing, severe overcrowding, and severe cost burden. As noted in Table A-43, renters experience housing problems at a much higher rate than owners, particularly renters that make less than 50 percent of area median income.
Table A-43 Number of Households with Any Housing Problem*
| Total Renters | Total Owners | Total Households | |
|---|---|---|---|
| Household Income ≤30% AMI with | |||
| Any Housing Problems | 255 | 140 | 395 |
| Household Income >30% to ≤50% AMI | |||
| with Any Housing Problems | 335 | 60 | 395 |
| Household Income >50% to ≤80% AMI | |||
| with Any Housing Problems | 165 | 180 | 345 |
Source: CHAS 2018
*CHAS defines ‘any housing problem’ as one or more of the following: lacks kitchen, lacks complete plumbing, severe overcrowding, and severe cost burden.
4. HOUSING CONSTRAINTS
Section titled “4. HOUSING CONSTRAINTS”Various interrelated factors may constrain the ability of the private and public sectors to provide adequate housing that meets the needs of all economic segments of the community. These constraints can be divided into two categories: governmental and non-governmental. Governmental constraints consist of land use controls, development standards, processing fees, development impact fees, code enforcement, development permit and approval processing, and provision for a variety of housing. Non-governmental constraints include land availability, land cost, site improvement costs, construction costs, and availability of financing.
4.1. GOVERNMENTAL
Section titled “4.1. GOVERNMENTAL”4.1.1. LAND USE CONTROLS
Section titled “4.1.1. LAND USE CONTROLS”The City of Yreka’s General Plan establishes policies that guide all new development, including residential land uses. These policies, along with zoning regulations, control the amount and distribution of land allocated for different land uses in the city. Table A-44 shows the residential land use designations established by the General Plan.
Table A-44 Residential Land Use Designations
| Designation | Maximum Density | Notes |
|---|---|---|
| Residential Agriculture (RA) | 2 units/acre | Large-lot single-family residential, either by design or by incorporation of previously developed county areas. Limited agricultural use due to higher residential density than conventional agriculture. |
| LowDensityResidential (LDR) | 6units/acre | Single-family development, found throughout much of the city. This designation could also allow single-family attached, townhouses, etc., with special zoning and design considerations. |
| MediumDensityResidential (MDR) | 10units/acre | Usually used for duplexes, triplex and fourplex development, as well as smaller apartment buildings. This designation could also supportgardenapartmentsandtownhouses. |
| HighDensityResidential (HDR) | 15units/acre | Conventional apartment or condominium development for largernumbers of units within a single project. |
| HistoricDistrict (HD) | 13 units/acre6 | A combination of commercial and residential uses located within the historic core of the city. These uses have a set of development criteria designed to help encourage the preservation and enhancement of the historic structures and uses. More pedestrian than vehicle oriented, development in this area of the city is oftenon smaller lots. |
Source: City of Yreka General Plan
4.1.2. RESIDENTIAL DEVELOPMENT STANDARDS
Section titled “4.1.2. RESIDENTIAL DEVELOPMENT STANDARDS”Zoning regulations are designed to protect and promote the health, safety, and general welfare of residents as well as to implement the policies of the General Plan. The Zoning Code also serves to preserve the character and integrity of existing neighborhoods. Table A-45 shows the zoning districts that permit residential development by-right, and the respective allowable densities and respective development standards. The lot and development standards of the by-right residential zones are objective. Table A-47 presents the same data categories for zones that conditionally permit residential development and applicants must apply for and secure a use permit before a building permit can be approved.
Table A-45 Zoning District Development Standards for Residential Uses
| Residential Agricultural (R-A) | LowDensity Residential (R-1) | MediumDensity Residential (R-2) | High Density Residential (R-3-12 &R-3-16) | Residential Professional Office (RPO) | |
|---|---|---|---|---|---|
| Density: Units Per Acre | 1 | 1-6 | 1-13 | 1-12,1-16 | 1-137 |
| MinimumLot Size | 43,560 sq. ft. | 7,000 sq. ft. | 8,000 sq. ft. | 14,000 sq. ft. | 7,000 sq. ft. |
| MinimumLot Width | 150’ | 70’ | 70’ | 70’ | 70’ |
| FrontYard Setback | 20’ | 20’ | 20’ | 20’ | 20’ |
| SideYard Setback | 10’ | 10’ on one side 5’ on the other | 10’ on one side 5’ on the other | 10’ | 10’ on one side 5’ on the other |
| RearYard Setback | 20’ | 20’ | 20’ | 20’ | 20’7 |
| Max.Building Height | 25’ | 25’ | 35’ | 35’ | 35’ |
| Max.Lot Coverage | 20%8 | 40% | 50% | 75% | 75% |
| Min.Parking Spaces Per Unit | 2 | 2 | 2 | 1½ | 27 |
| Parking Improvement | Both spaces in garage or carport | Both spaces in garage or carport | 1 space covered and 1 improved parking space | 1 space covered per family unit | 1 space covered and 1 improved parking space |
Source: City of Yreka Zoning Ordinance, 2013
A. The By-Right Residential Zones
Section titled “A. The By-Right Residential Zones”The Residential Agricultural (R-A) zone is a suburban residential zone that allows low density single family development and limited agricultural uses. Vacant parcels zoned R-A are found at the southern end of Yreka and in the section that is northeast of the intersection of Interstate 5 and Highway 3.
The Low Density Residential (R-1) zone allows conventional single family development. Two clusters of vacant R-1 parcels flank the City’s historic downtown and core to the north and southwest. Southeast of the intersection of Interstate 5 and Highway 3 there is a sizeable cluster of vacant R-1 parcels. Then at the southern end there is another cluster of vacant R-1 parcels. Altogether there is 177 vacant R-1 parcels with a combined acreage of 1,177 acres.
Medium Density Residential (R-2) is a transition zone between the R-1 and High Density Residential (R-3) zones having attributes of both. As shown in Table A-45, the lot and development standards are akin to those of the R1 zone, while the permitted residential density and types of residential uses of the R-2 zone are more similar to R-3. There are six vacant R-2 parcels that total 138 acres.
The High Density Residential (R-3) zone is intended to provide areas for higher density residential development including condominium development. As discussed further below, the R-3 zone’s default density is 16 dwelling units per acre. Currently there are seventeen vacant R-3 parcels in the City. Of those 17 parcels, the R-3 density of 13 parcels was modified and reduced to 12 dwelling units per acre, and are identified by their ‘R-3-12’ zoning. Aside from the change in allowable density, the R-3 zone’s lot and development standards remain the same. Combined the R-3-12 parcels total almost 75 acres. The four R-3 parcels with the unmodified density of 16 dwelling units per acre are identified as R-3-16, and total 7.3 acres.
The Residential Professional Office (RPO) zone is a mixed use zone allowing both residential and professional office uses. RPO is intended for areas which are typically transitional between commercial and residential uses, and does not prioritize commercial uses over residential uses. The lot standards and development standards are similar to those of R-1 zone while allowing greater lot coverage and taller structures. There are 12 vacant RPO parcels scattered in the City west of Interstate 5.
Lot Size and Density
Section titled “Lot Size and Density”The minimum residential lot sizes for the by-right residential zones range from 7,000 square feet to 1 acre. The largest minimum lot size applies to the Residential Agricultural (R-A) zone, a suburban residential zone that also allows limited agricultural uses. Generally, the lot size minimums and density ranges of the by-right residential zones are reasonable and can accommodate a range of residential uses. During the previous housing element cycle, the City did not receive any requests to develop designated 5th cycle inventory sites below the density anticipated in the inventory; lower density requests did not hinder the City’s progress on the 5th cycle RHNA. For the duration of the 5th cycle, nearly all development requests have been for SFR development on SFR planned/zoned parcels. The assisted multifamily development of Siskiyou Crossroads is the sole exception. Siskiyou Crossroads did not involve a lower density request.
Yreka’s two multifamily zones are the Medium Density Residential (R-2) and High Density Residential (R-3) zones. The zones are similar with respect to the type of housing units allowed, as shown in Table A-49 below, with the distinguishing attribute between the two zones being the maximum allowed density: the maximum allowable density in the R-2 zone is 13 dwelling units per acre, whereas the R-3 zone allows up to 16 dwelling units per acre, except where the zone is R-3-12, as discussed above.9 Because multifamily development (configured as duplexes, triplexes, and fourplexes) are allowed by-right in the RPO zone and commercial uses are not prioritized over residential uses, the RPO zone also functions as a multifamily zone.
As an incorporated city in a non-metropolitan/rural county, the City of Yreka may elect to use the default density of 15 dwelling units per acre to satisfy the requirement of Government Code Section 65583.2(c). When a jurisdiction uses and conforms to the default density standard, by operation of law the jurisdiction’s zoning standard is appropriate to accommodate housing for lower income households. The R-3 zone’s density of 16 dwelling units per acre meets threshold requirements of Government Code Section 65583.2(c), and the City of Yreka designates the R-3-16 as the zone to meet its lower income regional housing needs allocation (RHNA).
Lot Coverage
Section titled “Lot Coverage”The City’s maximum lot coverage standards for Residential Agricultural (R-A), Low Density Residential (R-1), High Density Residential (R-3-12 and R-3-16), and Residential Professional Office (RPO) are reasonable and do not present barriers for parcels to be developed with a variety of housing types.
The 50 percent lot coverage standard of the R-2 zone, however, may encourage properties in this zone to be developed at the lower end of the R-2 zone’s density range of 1-13 dwelling units per acre. For example, up to 4,200 square feet of a 7,000 square foot R-1 zone parcel (40 percent lot coverage on a parcel at the minimum parcel size) can be covered with structures. Whereas only 4,000 square feet of an 8,000 square foot R-2 zone parcel could be developed with structures (50 percent lot coverage on parcel at the minimum parcel size). In this example a developer would have increase building height to utilize the R-2 zone’s higher density of up to 13 dwelling unit pers per acre. Taller buildings are more costly to design and build. The R-2 zone’s maximum lot coverage of 50 percent may be the most significant barrier for these parcels being developed at the designated maximum density.
Building Height
Section titled “Building Height”The maximum height limit for residential units is 25 feet in the R-A and R-1 districts and 35 feet in the R-2, R-3, and RPO zones. In the past, the height limit has not inhibited multifamily development as demonstrated by the 61-unit Shasta Courtyards development that has four two-story buildings on 5.4 acres, the 81-unit Emerald Pointe Apartments that has five two-story buildings on 6.1 acres, and the 31-unit Sierra Vista Retirement Center that has a single three-story building on 2.5 acres.
Parking Standards
Section titled “Parking Standards”Parking Ratios: standards require a minimum of 2 parking spaces per unit in the R-A, R-1, R-2, and RPO zones and 1.5 spaces in the R-3 district. While historically the parking standards have been considered to be minimal and not a constraint to development, parking requirements add development cost from construction of the parking areas, ongoing maintenance, and the physical area they occupy. The initial cost to develop an uncovered parking stall is approximately $5000 per space and $2.42 per space per day in maintenance costs (Willson, 2013).10
Configuration of Multifamily Housing
Section titled “Configuration of Multifamily Housing”The R-2 zone allows housing developments to be configured as single-family dwellings, ADUs and JADUs, duplexes, triplexes, and fourplexes by-right. The R-2 zone does not allow housing developments to be configured as more than fourplexes, however. Housing developments in the R-2 zoning district are not subject to development requirements for minimum density, a maximum lot size standard to develop a single family dwelling, or demonstration that an R-2 parcel will have adequate area to support additional housing development including multifamily. The R-2 zone serves as a transition zone between R-1 and R-3, however. Like the R-2 zone, the RPO zone permits housing configured duplexes, triplexes, and fourplexes by-right. Multifamily housing configured as more than a fourplex is prohibited. The combination of the RPO zones lot and development standards, namely the 75 percent lot coverage, the allowance for a maximum density of 13 dwelling units per acre, and that commercial uses are not prioritize over residential uses, parcels zoned RPO zone have potential for supporting an intense level of development.
The R-3 zone allows the identical range of by-right housing configurations as the R-2 zone: single-family dwellings, ADUs and JADUs, duplexes, triplexes, and fourplexes. A developer must secure approval of a use permit to develop housing configured as more than fourplexes in the R-3 zone. The existing R-3 zone may impede multifamily development on two fronts:
- By-right housing unit configurations are limited to fourplexes. Housing configurations beyond a fourplex require a conditional use permit, which increases the cost, time, and risk for a housing developer to develop R-3 sites with multifamily development. This standard also reduces the developer’s flexibility to develop a site to accommodate on-site or adjacent environmental constraints and protected resources. At the same time the safety features of the building are dictated by building and fire codes which are not discretionary.
- The allowance for by-right a single family dwelling without other development requirements for minimum density, a lot size maximum for a single family dwelling development, or demonstration that an R-3 parcel will have adequate area to support additional housing development including multifamily. The by-right allowance for single family residential development creates the potential for the City’s lower income designated inventory sites to be underutilized with single family residential development. The absence of other requirements for single family development in the R-3 zone does not uniformly prioritize R-3 sites for multifamily development.
A conditional use permit for a multifamily housing with units configured as more than fourplexes entails a public hearing before the Planning Commission and this process typically takes six months. Two months of the sixmonth period is the City working with a developer on application review and code compliance. As a discretionary project, these types of housing developments are subject to the California Environmental Quality Act (CEQA). Although the environmental review usually results in the preparation of a negative declaration (i.e., a finding that there is no substantial evidence that the project will have a significant effect on the environment) for the project this process takes about four months. There are no design standards, architectural review, or other criteria applied except normal setbacks, building height, lot coverage, density, and parking requirements. The Planning Commission primarily considers potential environmental impacts, as well as public improvements (e.g., curb, gutter, sidewalk, and drainage improvements) that may be necessary to support the project. The entire process from submittal to public hearing and project approval is typically about six months. Should a project be appealed to the City Council, another three to four weeks could be added to the processing time, but this has not occurred on the few projects processed in recent years. While the conditional use permit process adds an application step, historically projects have not been denied nor have projects been altered in a manner which would affect project feasibility. Once the entitlement process is complete, the building permit process typically takes another three months for applicants to complete and another month for building review and approval. Overall, planning and building for a housing project with units configured as more than fourplexes would be 9 to 12 months. The City acknowledges the conditional use process adds approximately six months which represents a constraint. It is also recognized what has been the typical conditional use permit process is subject to change because of the discretionary nature of the process.
While the City’s 5th cycle housing element did not consider the conditional use requirement to be a significant constraint on the development of affordable housing, it can be a deterrent for both market rate and non-profit housing developers. The discretionary permit process inherently adds time, costs, and introduces risk because the outcome on the entitlement is uncertain. The developer is not only incurring costs associated with securing the entitlement, during the duration of the entitlement process developers incur carrying costs, e.g., property taxes, mortgage payments, insurance, maintenance, etc. The discretionary permit process by its nature also increases risk because approval of the entitlement is not assured. The discretionary permit process may result in conditions of approval and mitigation measures being attached to the entitlement, and these may increase development costs. As a result, market-rate housing developers and investors ‘often require higher returns depending on the perceived risk’ (https://ternercenter.berkeley.edu/development-calculator-dashboard/#local governmentfactors, Terner Center for Housing Innovation, accessed May 28, 2022). Developers’ and investors’ expectations for higher returns are added to the project’s overall costs. Ultimately these costs are passed along to the consumer, whether the consumer is a renter or a home buyer. For affordable housing projects there are a limited number of federal and state funding sources that can be used to subsidize pre-development costs, e.g., Community Development Block Grant (CDBG). But these funding sources are often oversubscribed and are highly competitive. Many funding sources require projects to be ‘shovel ready’, meaning any necessary entitlements are secured by the developer. Due to the increased time and cost described above, it may be necessary for the non-profit housing developer to secure additional funding, stacking multiple sources of funding to construct the project.
Occupancy Standards
Section titled “Occupancy Standards”While less common today, historically jurisdictions have used their zoning regulations to discriminate against group and congregate living situations by way adopting a narrow and traditional definition of family. The City does not regulate occupancy of residential units. While Section 16.12.480 of the Zoning Code seemingly provides a broad definition of ‘family’ that is inclusive of tradition and non-traditional living situations: ‘Family means a group of individuals with a common bond by means of blood, marriage, or conscientiously established relations living together as a housekeeping unit sharing a dwelling unit. Clients of a group home subject to California Community Care Facilities Act (Health and Safety Code 1500 et seq.) are not deemed a family for purposes of this title’, the definition’s inclusion of ‘…a common bond by means of blood, marriage, or conscientiously established relations…’ language is a constraint. Program HE-6.1.6 commits the City to updating its definition of family to comply with State law.
Summary
Section titled “Summary”Presently there are 258 vacant parcels that total 2,056 acres that allow by-right residential development, as summarized in Table A-46 below. Parcels zoned R-A and R-1 comprise nearly 89 percent, or greater than 1,825 acres, of this inventory. The most common size of R-A and R-1 parcel is 0.30 and 0.50 acres, or 13,068 and 21,780 square feet, respectively. As for parcels zoned R-2, R-3-12, and R-3-16, there are only 23 parcels that altogether comprise 220 acres, or almost 11 percent of the City inventory of land now zoned to allow by-right multifamily development.
Table A-46 Summary of Vacant By-Right Parcels
| Parcel Count by Zoning | Total Acreage by Zone | Avg. Parcel Size (acres) | %ofTl. Acreage | Smallest Parcel (acres) | Largest Parcel (acres) | |
|---|---|---|---|---|---|---|
| R-1 | 177 | 1,177.3 | 6.65 | 57.3% | 0.01 | 141 |
| R-2 | 6 | 138.4 | 23.07 | 6.7% | 0.07 | 136.9 |
| R-3-12 | 13 | 74.6 | 5.74 | 3.6% | 0.04 | 44.8 |
| R-3-16 | 4 | 7.3 | 1.82 | 0.35% | 0.19 | 5.53 |
| R-A | 46 | 648.6 | 14.1 | 31.6% | 0.02 | 140.4 |
| RPO | 12 | 9.6 | 0.8 | 0.47% | 0.01 | 5.6 |
| Total | 258 | 2,055.9 | 7.97 | 100% |
The current zoning creates a significant inventory of land affording opportunities to develop new single family dwellings, ADU and junior ADUs, and SB 9 housing developments. However, opportunities to develop multifamily and denser residential development are limited due to the small number of parcels that are zoned to allow by-right multifamily development. Finally, it is noted that the small size of some parcels (less than 500 square feet in size) may impede development. Property owners may find it necessary to consolidate these parcels with larger adjoining properties.
B. Zones Where Residential Uses Are Conditionally Permitted
Section titled “B. Zones Where Residential Uses Are Conditionally Permitted”Table A-47 identifies the zones that conditionally permit residential uses. All of these zones specify a minimum lot size of 7,000 square feet and maximum allowable building height is 35 feet. Except for the CPO zone, the C2, CH, and CT zones do not specify a minimum or maximum residential density or the minimum number of parking spaces to be provided. As part of the conditional use permit process and on a project-by-project basis it is likely these variables would be determined. In the case of the parking standards, staff may consult the parking standards for similar uses to develop an estimate for the number of parking spaces. The absence of objective density and parking standards adds uncertainty for housing development proposals in these zones. This added uncertainty would accompany increases in time, cost, and risk described above.
Table A-47 Zoning District Development Standards for Residential Uses
| Commercial Professional Office (CPO) | Commercial Neighborhood (C-2) | Commercial Highway (CH) | Commercial Tourist (CT) | |
|---|---|---|---|---|
| Units Per Acre | 1-1311 | - | - | - |
| MinimumLot Size | 7,000 sq. ft. | 7,000 sq. ft. | 7,000 sq. ft. | 7,000 sq. ft. |
| MinimumLot Width | 70’ | 50’ | 70’ | 70’ |
| FrontYard Setback | 20’ | None | 20’ | 20’ |
| SideYard Setback | 10’ | 10’ | 10’ | 10’ |
| RearYard Setback | 20’11 | None | 10’ | 10’ |
| Max.Building Height | 35’ | 35’ | 35’ | 35’ |
| MinimumParking Spaces Per Unit | 211 | - | - | - |
| Max.Lot Coverage | 60% | 100% | 100% | 100% |
Source: City of Yreka Zoning Ordinance, 2013
Of the four zones identified in Table A-47 that allow conditionally allow residential uses, there are 61 vacant parcels that total 145.5 acres, except there are no vacant CPO parcels presently. Table A-48 summarizes vacant parcels presently zoned to allow residential development with a use permit. The data indicate at this time there are no parcels in the CPO zone that are vacant. There are 41 vacant parcels in the Commercial Highway (CH) zone that comprise 134 acres altogether. The availability of CH parcels dwarfs the 20 vacant C-2 and CT parcels that are 11 acres when combined.
Table A-48 Summary of Vacant Parcels Where Residential Uses Require a Use Permit
| Parcel Count by Zoning | Total Acreage by Zone | Avg. Parcel Size (acres) | %ofTl. Acreage | Smallest Parcel (acres) | Largest Parcel (acres) | |
|---|---|---|---|---|---|---|
| C-2 | 9 | 1.2 | 0.1 | 0.8% | 0.01 | 0.3 |
| CH | 41 | 134.2 | 3.3 | 92.2% | 0.02 | 29.7 |
| CT | 11 | 10 | 0.9 | 6.9% | 0.07 | 3.5 |
| Total | 61 | 145.5 | 2.4 | 100.0% |
4.1.3. PROVISIONS FOR A VARIETY OF HOUSING
Section titled “4.1.3. PROVISIONS FOR A VARIETY OF HOUSING”The Housing Element must identify adequate sites that are available for the development of housing types for all economic segments of the population. Part of this entails evaluating the City’s Zoning Code and its provision for a variety of housing types. The City’s Zoning Code provides for many types of housing as indicated in Table A-49. While the Zoning Code provides for a diverse range of housing types, recent amendments to State law for navigation centers, supportive housing developments, etc. obligate the City to amendment its Zoning Code. Accordingly, Chapter 2 Goals, Policies and Programs includes Program HE-7.1.1 committing the City to completing these Zoning Code amendments as part of its General Plan update. Assembly Bill 2634 (Lieber, 2006) requires the quantification and analysis of existing and projected housing needs of extremely low-income households. Elements must also identify ways to encourage and facilitate housing for extremely low-income households.
Table A-49 Housing Types Permitted by Zoning District
| ResidentialUses | R-A | R-1 | R-2 | R-3 | RPO | CPO | C-1 | C-2 | CH | CT | M-1 | M-2 |
|---|---|---|---|---|---|---|---|---|---|---|---|---|
| Single-FamilyDwelling | P | P | P | P | P | C | E | C | C | C | C | C** |
| ADUandJADU | P | P | P | P* | P* | P* | E | P* | P* | P* | C | E |
| SecondSingle-FamilyDwelling | P | P | P | P | P | C | E | C | C | C | C | E |
| Duplexes | E | P | P | P | P | C | E | C | C | C | C | E |
| TriplexesandFourplexes | E | E | P | P | P | C | E | C | C | C | C | E |
| Five or MoreUnits | E | E | E | C | E | E | E | C | C | C | C | E |
| Condominiums | E | E | P | C | P | C | E | C | C | C | C | E |
| MobileHomesonIndividual Lots | P | P | P | P | P | C | E | C | C | C | E | E |
| GroupCareHome - Small (= six andfewer individuals) | P | P | P | P | P | C | E | C | C | C | E | E |
| GroupCareHome - Large (= greaterthansix individuals) | E | E | C | P | P | C | E | C | C | C | E | E |
| MobileHomePark | E | E | E | C | E | E | E | C | C | C | C | E |
| Employee Housing - Small | P | P | P | P | P | C | E | C | C | C | E | E |
| Employee Housing - Large | P | E | P | P | P | C | E | C | C | C | E | E |
| Transitional and Supportive Housing | P | P | P | P | P | C | E | C | C | C | E | E |
| Supportive Housing Developments† | P | P | P† | P† | P† | C† | E | C | C | C | E | E |
| Emergency Shelters | E | E | E | E | E | E | E | E | E | E | P | E |
| LowBarrier Navigation Centers† | E | E | P† | P† | P† | P† | E | P | C | C | E | E |
| Single-Room Occupancy Units | E | E | E | E | E | E | E | C | C | C | E | E |
Source: City of Yreka Zoning Ordinance
P = Permitted C = Conditional Use Permit E = Excluded
- = Permitted with existing or proposed single- or multifamily dwelling with an approved use permit also in the M-1 zone
† Title 16 of the Yreka Municipal code to be amended to add use
** = Caretaker Residence not to exceed 1,500 square feet.
A. Accessory Dwelling Units and Junior Accessory Dwelling Units
Section titled “A. Accessory Dwelling Units and Junior Accessory Dwelling Units”Accessory dwelling units (ADU) and Junior Accessory dwelling units (JADU) are types of housing that may be more affordable by design. An ADU is an accessory dwelling unit with complete independent living facilities for one or more persons, and may be configured as detached or attached from the primary unit, be converted from existing space or structure such as a garage or pool house. A JADU is a specific type of conversion of existing space that is contained entirely within an existing or new single-family residence, and cannot be more than 500 square feet. A JADU may share central systems, contain a basic kitchen utilizing small plug-in appliances, may share a bathroom with the primary dwelling, all to reduce development costs. An ADU may be rented for more than 30 days; JADUs may also be rented for more than 30 days but either the JADU or the primary unit must be occupied by the property owner.
The 2017 Legislative Housing Package brought sweeping amendments to State accessory dwelling law to remove regulatory barriers at both the state and local level. State law requires jurisdictions to permit ADUs and JADUs by-right in all areas that are zoned to allow single-family and multifamily residential uses. Jurisdictions must allow conversion of existing accessory structures to ADUs. State law limits development standards such as setbacks and lot coverage that a jurisdiction may impose, along with limiting local parking requirements and the imposition of impact fees. Development and design standards that may be adopted by local government must be objective. ADUs and JADUs that conform with State law shall not be considered to exceed the allowable density for a lot and are deemed a residential use that is consistent with the existing general plan and zoning designations for the lot. ADU/JADU ordinances adopted by jurisdictions are subject to HCD review for compliance with State law. Specific to Housing Element updates, a jurisdiction’s housing element must include a plan that incentivizes and promotes creation of ADUs that can offer affordable rents for very low, low- or moderate income households.
The City adopted Zoning Ordinance amendments to allow ADUs and JADUs consistent with State law first in 2018 then again in 2020. Table A-49 provides an overview of the zones permitting ADUs and JADUs. Consistent with State law, the Yreka Zoning Code increases the range of zones where ADUs and JADUs are allowed by-right; reduces requirements for setbacks, parking, eliminates a previous minimum lot size requirements, expressly prohibits using ADUs and JADUs as short term rentals (also known as vacation home rentals). Highlights of the City’s current ADU-JADU Ordinance:
-
ADUs and JADUs are allowed by-right in R-A, R-1, R-2, R-3, and RPO zones. In these zones single family dwellings and multifamily dwellings (up to fourplexes) are allowed by-right. In the CPO, C-2, CH, CT, and M-1 zones, ADUs and JADUs are permitted by-right when the property has an existing or proposed single- or multifamily dwelling with an approved use permit.
-
The unit may be rented for periods of no less than 30 days.
-
There are no connection fees charged to ADUs and JADUs.
-
The ADU is not intended for sale separate from the primary, although passage of AB 345 (2021) allows an ADU to be sold separately when the accessory dwelling unit or the primary dwelling was built or developed by a qualified nonprofit corporation and the other requirements are met (chaptered at Government Code Section 65852.26).
-
The lot needs to contain an existing or proposed single-family or multifamily dwelling. When the ADU or JADU is proposed a new single- or multifamily the primary dwelling shall be approved for occupancy prior to occupancy of the ADU/JADU.
-
Owner-occupancy of the parcel is not a requirement to apply for the construction of an ADU or JADU. In the case of a JADU, however, owner occupancy of the single-family residence in which a JADU will be permitted is required. The owner may occupy either the remaining area of the primary dwelling or the JADU. Disclosure of the JADU occupancy requirement is to be recorded on the property deed.
-
The ADU may either be attached or detached from the existing or proposed dwelling and located on the same lot. Junior ADUs, however, must be attached to the existing dwelling and located within the living area of the proposed or existing dwelling.
Although the City amended its Zoning Code to align with the requirements of State law thereby removing regulatory barriers to ADU and JADU development, to date the City has not received building permit applications to develop ADUs or JADUs. ADUs and JADUs are types of housing that can be less costly to develop and have less impact on the environment as they are generally infill development. Securing building permit approval to develop an ADU or JADU in residential zones is nearly assured because of State mandates and oversight that include a 60-day shock clock (AB 3182 (2020)). ADUs and JADUs give homeowners the flexibility to share independent living areas with family members and others, including accommodating intergeneration living arrangements while maintaining privacy. ADUs or JADUs can provide housing for professionals who may prefer to live closer to jobs and amenities rather than spending hours commuting. Ultimately spurring ADU and JADU development can positively contribute more affordable housing to the community’s inventory.
Increasing the number of ADUs and JADUs heavily relies on property owners developing the units. While ADUs and JADUs present an opportunity for property owners, the prospect of adding a dwelling may be daunting for property owners. The process of constructing a dwelling or converting a structure to a dwelling from start to finish may be a barrier for lay-property owners who may have questions about where to put the unit, how much will it cost and how to pay for it, how long it will take to build, who will live it, expected return on investment, etc. Program HE-5.1.1 seeks to reduce and remove these barriers by promoting and encouraging ADU and JADU development in Yreka by homeowners by developing an educational toolkit and launching an outreach campaign.
The objective of Program HE-5.2.1 is to increase the range of allowable ADU housing types by introducing moveable tiny houses as an ADU option which may be a more affordable form of housing. Program HE-5.2.1 commits the City to preparing Zoning amendments that would allow the installation of moveable tiny houses as an ADU. Like traditional construction, a moveable tiny house will be subject to public health and safety standards. As part of the ordinance, the City may impose objective design standards that are consistent with State ADU laws.
Summer 2022, Freddie Mac began offering financing for development of ADUs. The new product is the Freddie Mac Choice Renovation loan, a ‘for a no-cash-out refinance…to pay off the temporary funding source for ADU construction’. Also, more homeowners will qualify because the anticipated rental income from the ADU can be part of the qualifying income, according to the press release https://sf.freddiemac.com/ content/_assets/resources/pdf/fact-sheet/adu-fact-sheet.pdf, accessed June 29, 2022). In 2022 the State of California Housing Finance Agency (CalHFA) launch the ADU grant program that provides up to $40,000 to reimburse pre-development and non-recurring closing costs associated with the construction of the ADU for eligible homeowners. According to the CalHFA website, ‘Predevelopment costs include site prep, architectural designs, permits, soil tests, impact fees, property survey, and energy reports’ (https://www .calhfa.ca.gov/adu/index.htm, accessed June 29, 2022). Homeowners must be low or moderate income in order to be eligible to apply for the CalHFA program. The income limits for Siskiyou county are $159,000. The Freddie Mac and CalHFA programs offer loans and financial assistance directly to the customer. The educational toolkit will include information about these financial resources.
Program HE-5.1.2 commits the City to applying for State funding that allows awarded funds to be used for ADU development, e.g., CalHOME, also collaborating with the County and the other cities for the establishment of a regional housing trust fund that elects to earmark funds for ADU development, and other actions that can improve financial resources available to residents for ADU development.
B. Senate Bill 9 (2021) Two Housing Units and Ministerial Lot Split
Section titled “B. Senate Bill 9 (2021) Two Housing Units and Ministerial Lot Split”Senate Bill 9 (SB 9) was signed into law in September 2021, and is chaptered at Government Code Sections 65852.21, 664117.7, and 66452.6. SB 9 requires local agencies to ministerially approve a housing development with no more than two primary units in a single-family zone, the subdivision of a parcel in a single-family zone into two parcels, or both. SB 9 facilitates the creation of up to four housing units in the lot area typically used for one single-family home. Key provisions of the law require a local agency to modify or eliminate objective development standards on a project-by-project basis if they would prevent an otherwise eligible lot from being split or prevent the construction of up to two units at least 800 square feet in size. Local implementation of SB 9 does not require cities or counties to adopt an implementing ordinance. Table A-50 itemizes the threshold eligibility requirements of SB 9 and their application specific to the City.
Table A-50 Application of SB 9 (2021) Threshold Eligibility Criteria in the City of Yreka
| SB 9 (2021) Threshold Criteria | SB 9 (2021) Threshold Criteria | City of Yreka |
|---|---|---|
| 1 | The proposed housing development is located on a parcel within a city, the boundaries of which include some portion of either an urbanized area or urban cluster, as designated by the United States Census Bureau. | Portions of Yreka are within a US Census designated urbanized area according to the 2010 Census, the most current finalized data. This means parcels and housing developments in the City are eligible to utilize SB 9 (2021) provided the other SB 9 (2021) criteria are met. |
| 2 | A parcel must be located in a single family residential zone | The City’s Single-Family Residential (R-1) zone meets the statutory eligibility criteria. The City’s other residential zoning districts are not eligible for SB 9 (2021). |
| 3 | None of the site conditions listed in Government Code section 65913.4, subdivision (a)(6)(B-K) are present on the parcel and do not apply to the parcel. | Theconditions that maydisqualify a propertyfromusingSB9include the presence of farmland, wetlands, fire hazard areas, earthquake hazard areas, flood risk areas, conservation areas, wildlife habitat areas, or conservation easements. Program HE-5.1.1 will screen parcels at a programmatic level to identify potential SB 9 eligible parcels. |
| 4 | A project is not eligible for SB 9 (2021) if it is located in a historic district or property included on the State Historic Resources Inventory or within a site that is designated or listed as a city or county landmark or as a historic property or district pursuant to a city or county ordinance. | Parcels located in the City’s historic districts are not eligible for SB 9 (2021). |
All the above criteria must be met in order for a housing development and the parcel subject to the development to be able to utilize SB 9. There are anti-displacement requirements and limits on demolition requirements that are evaluated on a project-by-project basis. For SB 9 ministerial lot splits there are additional requirements, with the following being key:
-
The applicant must occupy one of the housing units for at least three years
-
No more than two lots can be created, and the lots are to be of approximately equal lot area provided that one parcel shall not be smaller than 40 percent of the lot area of the original parcel proposed for subdivision.
-
Both newly created parcels are no smaller than 1,200 square feet, unless the City elects to adopt an ordinance allowing for a smaller minimum lot size.
-
Lots created by SB 9 cannot be resubdivided under the same law.
Like ADUs and JADUs, increasing housing production using SB 9 heavily relies on homeowners taking advantage of the new law and similar barriers are expected. Consequently, Program HE-5.1.1 commits the City to creating a toolkit and launching a public outreach campaign that includes SB 9. It is noted that the City’s current R-1 zone allows duplexes by-right on corner lots and SB 9 will expand this option to a larger population of parcels and provides greater flexibility.
C. Mobile/Manufactured Homes and Parks
Section titled “C. Mobile/Manufactured Homes and Parks”In all of the by-right residential zones, a manufactured home installed on a permanent foundation is allowed byright in lieu of conventional single-family dwelling construction subject to the following objective requirements:
- Each manufactured home must have a minimum eave overhang of 16 inches; and
- No more than 10 years have elapsed between the date of the home’s manufacture and the date of the application for the issuance of the building permit.
Manufactured homes in conformance with the above standards may be installed as an ADU. The City’s allowance and standards for manufactured homes in residential zones are reasonable and have not been an impediment.
There are nine mobilehome parks operating in Yreka according to a June 2, 2022, search of the State Department of Housing and Community Development’s Codes and Standards Automated System (CASAS). Section 16.48.010 of the Yreka Municipal Code (YMC) enumerates that manufactured home parks are permitted in the High-Density Residential (R-3), Commercial Highway (CH), and Light Industrial (M-1) upon approval of a conditional use permit. Although YMC Section 16.48.010 does not enumerate the Commercial Tourist (CT) zone, the language of YMC Section 16.38.060(E), ‘[a]ll uses allowed in the C-2 and CH zone districts’ extends allowance for mobile home parks with an approved conditional use permit to the CT zone. The minimum site area to develop a new mobilehome park is two acres (YMC Section 16.48.030). The layout of a new mobilehome park must meet objective standards for a minimum space size of 3,000 square feet, provide at least 10 feet of separation between homes, not site spaces in setback yard areas, and provide at least 100 square feet of indoor or outdoor recreation area. Parking is to be provided at a ratio of at least two spaces per space and must be improved with a base and double chip and seal. The YMC does not stipulate that both parking spaces be sited adjacent to the unit. There are other standards pertaining to accessory structures and perimeter landscaping. Although development of a new mobilehome park requires an entitlement, the YMC specifies a number of zones where a park may be sited. There are numerous vacant CH and M-1 zoned parcels. The development standards are generally reasonable and objective. The parking space siting standards are flexible although the ratio may be excessive for a seniors-only park. For an age restricted park, an applicant would have the option to seek a reduction for the number of parking spaces as part of the conditional use permit application pursuant to YMC Section 16.54.140.
Mobilehome parks provide housing that is typically naturally occurring affordable housing. While it is unlikely that existing parks in the City will be closed or converted to another use, to ensure park residents are provided adequate notice, relocation and other assistance should a park be subject to closure or conversion, Program HE-
4.1.1 commits the City to preparing and adopting a mobilehome park conversion ordinance consistent with Government Code Section 65863.7.
D. Housing for Persons with Disabilities and Persons Experiencing Homelessness
Section titled “D. Housing for Persons with Disabilities and Persons Experiencing Homelessness”As part of a governmental constraints analysis, housing elements must analyze constraints on the development, maintenance, and improvement of housing for persons with disabilities. This includes a review of zoning and land use policies and practices to ensure:
- Compliance with fair housing laws;
- A provision exists for group homes for six or more persons;
- A broad definition of family is included in the zoning code in order to provide occupancy standards specific to unrelated adults, as well as comply with fair housing law;
- Siting or separation requirements for licensed residential care facilities do not impact the development and cost of housing for persons with disabilities; and
- The inclusion of alternate residential parking requirements for persons with disabilities.
Reasonable Accommodation Procedures
Section titled “Reasonable Accommodation Procedures”The City permits certain projections and structures within yard and setback areas. Among the allowances are facilities for access to residential structures by persons with disabilities. For example, ramps or lifts for handicapped accessibility are permitted within yard and setback areas. Such requests are approved administratively unless the site is located with the City’s designated historic district and the nature of the request triggers major design review pursuant to the City’s codified historic preservation overlay zone (see section 4.1.7 below for a summary of design review process). The City adopted reasonable accommodation procedures in July 2013 in accordance with a 4th cycle housing element program. The City readily offers the accommodation procedure to request reasonable accommodation for persons with disabilities seeking equal access to housing under the Federal Fair Housing Act and the California Fair Employment and Housing Act (the Acts) in the application of zoning laws and other land use regulations, policies, and procedures. An example of reasonable accommodation is when a municipal jurisdiction allows a deviation from the strict interpretation of zoning standards for someone with a demonstrated need resulting from a disability. Pursuant to state law, the City established appropriate reasonable accommodation procedures to meet the needs of a person with disabilities. To make the City’s reasonable accommodation procedures easier to locate and more readily available to the public, Program HE-6.1.2 commits the City reviewing the existing procedures for conformance with applicable federal and state laws, adopting any necessary amendments, and amending the Yreka Municipal Code to incorporate the City’s reasonable accommodation procedures.
Parking standards for houses or group homes for persons with disabilities may be modified through a parking waiver issued by the Planning Commission in accordance with Zoning Code Section 16.54.140(B), when such a waiver is not detrimental to the public health and safety and would not cause an unreasonable hardship. Federal and state law requires the reasonable accommodation process be available to both persons with disabilities and providers of housing for persons with disabilities, however. Moreover, reasonable accommodation findings relate to whether the accommodation is for a protected individual, equal opportunity to use and enjoy a specific dwelling, and not impose an undue financial and administrative burden or a fundamental alteration to the land use or zoning laws, policies, or procedures of the jurisdiction. Zoning Code Section 16.54.140(B) existing language concerning parking exception requests may cause uncertainty in the context of a reasonable accommodation request. Program HE-6.1.2 commits the City to auditing its adopted procedures and updating the procedures as needed to ensure the procedures extend to housing providers and the Zoning Ordinance parking requirements, and that the findings and other elements of the procedures comport with current federal and state law.
Supportive Housing
Section titled “Supportive Housing”Supportive housing is defined by Section 65582 of the Government Code as housing with no limit of stay, that is occupied by a target population, and is linked with on- or off-site services that assist the supportive housing resident in retaining the housing, improving his or her health status, and maximizing his or her ability to live and, when possible, work in the community. The target population is defined by Government Code Section 65582 as persons with low incomes who have one or more disabilities including mental illness, HIV or AIDS, substance abuse, or other chronic health condition, or an individual eligible for services provided pursuant to the Lanterman Developmental Disabilities Services Act (Division 4.5 [commencing with Section 4500] of the Welfare and Institutions Code) and may include, among other populations, adults, emancipated minors, families with children, elderly persons, young adults aging out of the foster care system, individuals exiting from institutional settings, veterans, and homeless people. The City permits transitional and supportive housing in all the by-right residential zones, that is R-A, R-1, R-2, R-3, and RPO. In the CPO, C-2, CH, and CT zones supportive housing is permitted with a conditional use permit. Both transitional and supportive housing are excluded from the M-1 zone. The definitions of transitional and supportive housing, YMC Sections 16.12.776 and 16.12.773 respectively, comport with the definitions of Government Code Section 65582(g) and 65582(j). It is noted that the YMC Section 16.12.773 definition of supportive housing defines the target population by referencing Health and Safety Code Section (HSC) 53260(d). While the definition of target population in Section 53260(d) of the HSC aligns with the definition at Government Code Section 65582(i), the definition at HSC Section 53260(d) is difficult to locate. It is difficult to locate because it was part of the California Statewide Supportive Housing Initiative Act which sunset in 2009. Program HE-7.1.1 directs the City to amend the Zoning Code such that the definition of target population is easy for all users to locate and is consistent with Government Code Section 65582(i).
In 2018, AB 2160 was signed into law and added Article 11 ‘Supportive Housing’, commencing at Section 65650, to Chapter 3, Division 1, Title 7 of the Government Code. AB 2160 applies to a narrowly defined group of housing developments, and complements existing law for supportive housing discussed above. AB 2160 mandates jurisdictions allow qualifying supportive housing developments by-right. More specifically, the new law obligates jurisdictions to permit qualifying supportive housing developments as by-right in zones where multifamily and mixed uses are permitted, including nonresidential zones permitting multifamily uses, when the proposed housing development meets all the requirements. For a housing development to be eligible as a by-right supportive housing development it must be meet all the following:
-
Units within the development are subject to a recorded affordability restriction for 55 years.
-
100 percent of the units, excluding managers’ units, within the development are restricted to lower income households and are or will be receiving public funding to ensure affordability of the housing to lower income Californians. For purposes of this paragraph, ‘lower income households’ has the same meaning as defined in Section 50079.5 of the Health and Safety Code. The rents in the development shall be set at an amount consistent with the rent limits stipulated by the public program providing financing for the development.
-
At least 25 percent of the units in the development or 12 units, whichever is greater, are restricted to residents in supportive housing who meet criteria of the target population. If the development consists of fewer than 12 units, then 100 percent of the units, excluding managers’ units, in the development shall be restricted to residents in supportive housing.
-
The target population of the supportive housing units are persons and families who have experienced homelessness.
-
The developer provides the planning agency with plan for providing supportive services, with documentation demonstrating that supportive services will be provided onsite to residents in the project, and contains all of the information required by Section 65652.
-
Nonresidential floor area shall be used for onsite supportive services in the following amounts:
-
(A) For a development with 20 or fewer total units, at least 90 square feet shall be provided for onsite supportive services.
-
(B) For a development with more than 20 units, at least 3 percent of the total nonresidential floor area shall be provided for onsite supportive services that are limited to tenant use, including, but not limited to, community rooms, case management offices, computer rooms, and community kitchens.
-
The developer replaces any dwelling units on the site of the supportive housing development in the manner provided in paragraph (3) of subdivision (c) of Section 65915.
-
Units within the development, excluding managers’ units, include at least one bathroom and a kitchen or other cooking facilities, including, at minimum, a stovetop, a sink, and a refrigerator.
Jurisdictions may require supportive housing developments to comply with written, objective development standards but only to the extent that the objective standards apply to other multifamily development within the same zone. The number of by-right supportive housing units in a qualifying development is limited to 50 units for cities with populations of less 200,000 and a population of less 1,500 persons experiencing homelessness according to the most recent Point in Time Count. Jurisdictions may elect to adopt a policy to allow qualifying supportive housing developments with more than 50 by-right supportive housing units.
Group Homes and Community Care Facilities
Section titled “Group Homes and Community Care Facilities”The City’s definition of group homes and community care facilities includes a wide range of non-medical shelter facilities with supportive services for children, adults, families, and persons with disabilities. Examples include family homes, group care homes, day-care centers for children or adults, foster care homes, and community centers and private clubs in which care is provided. The Zoning Code defines facilities of six or fewer persons as Group Care Home - Small. Facilities serving seven or more persons are defined as Group Care Home - Large. Group Care Home - Small are principally permitted in R-A, R-1, R-2, R-3 and RPO zones, but need a use permit in CPO, C-2, CH, and CT zones. Group Care Home - Large allowed by-right in R-3 and RPO zones, and are subject to securing a use permit in R-2, CPO, C-2, CH, and CT zones. The City does not have any special requirements for residential care facilities, such as minimum distances between facilities. With a limited number of such group homes, no standards for separation exist in either the General Plan or the Zoning Ordinance.
As discussed above, while the definition of ‘family’ contained in Section 16.12.480 of the Zoning Code seems to be broad and inclusive of tradition and non-traditional living situations, it is constraint because the definition includes an ambiguous requirement for a ‘common bond by means of blood, marriage, or conscientiously established relations living’. The current definition of ‘family’ excludes clients of a group home subject to California Community Care Facilities Act (Health and Safety Code 1500 et seq.). Program HE-6.1.6 commits Yreka to updating the definition of family to comport with State law.
To remove regulatory barriers and encourage the development of a range of group care facilities in the Medium Density Residential (R-2), High Density Residential (R-3), Commercial Downtown (C-2), Commercial Highway
(CH) and CT zones the City will amend the Zoning Code to remove the differentiation between small and large group care facilities and permit group care facilities as a by-right use (Program HE-7.2.1).
For rest homes, nursing homes, convalescent homes, and homes for the aged, the Zoning Code requires one parking space for each employee, plus one space for each [every] four beds. If the need is demonstrated by the applicant, the Planning Commission could modify these standards pursuant to Section 16.54.140(B). Parking requirements are 2 spaces for single-family dwellings and 1.5 spaces per multifamily unit.
Emergency Shelters, Low Barrier Navigation Centers and Transitional Housing
Section titled “Emergency Shelters, Low Barrier Navigation Centers and Transitional Housing”2007 State legislation (Senate Bill 2) requires jurisdictions to identify a zone or zones where emergency shelters will be allowed as permitted uses without a conditional use permit or other discretionary permit. Emergency shelters are defined in Government Code Sections 65582(d) and 65583(a)(4). Government Code Section 65582(d) incorporates by reference the definition in California Health and Safety Code (HSC) Section 50801: an emergency shelter is ‘housing with minimal supportive services for homeless persons that is limited to occupancy of six months or less by a homeless person. No individual or households may be denied emergency shelter because of an inability to pay.’ Effective January 1, 2023, the definition of emergency shelter was expanded pursuant to Assembly Bill 2339 to include other interim housing interventions, including, but not limited to, a navigation center, bridge housing, and respite or recuperative care [Reference Government Code Section 65583(a)(4)(C)]. Program HE-7.1.1(4) commits the City to amending the current definition of emergency shelter to include other interim housing interventions consistent with the cited Government Code Section.
The zone or zones designated by a city must have land available to accommodate at least one full-time emergency shelter, and the zone must allow other residential uses either by-right or with a conditional use permit if the locality’s designated emergency shelter zone is nonresidential. As shown in Table A-49,Yreka’s Light Industrial (M-1) zone allows emergency shelters by-right, and other residential uses with a conditional use permit pursuant to the language of YMC Section 16.40.070. Therefore, Yreka’s existing M-1 zone satisfies emergency shelter zoning requirement of subparagraph (H)(ii) of Government Code Section 65583(a)(4).
There are 43 vacant M-1 parcels that total 240 acres with adjacent sewer and water infrastructure are available to meet this need. The smallest M-1 parcel is 0.11 acres (or 4,800 square feet) and the largest is 44 acres in size. The average and median sizes of M-1 zoned parcels are 5.6 and 2.6 acres, respectively. There are 28 vacant M-1 parcels that are between 0.50 acres and 10 acres in size, which represents 65 percent of M-1 parcels. There are 8 parcels less than 0.5 acres and 7 parcels that are greater than 10 acres in size. The M-1 zoning is located along Foothill Drive, east of Interstate 5, and in the southern portion of the city between Greenhorn Drive and Moonlit Oaks. The portion of M-1 zoning in the southern portion of the city has access to four transit stops actively used by the Siskiyou County Transit Authority (STAGE). In addition, there are two shopping centers with additional services in this area (Figure 4). The properties located on Foothill Drive has three stops at the YMCA, Veteran’s Services, and Juvenile Hall. One of these transit stops is adjacent to a shopping center with additional services. These stops are all approximately one mile apart from each other. The M-1 zone is the primary location for industrial uses historically and currently. Industrial sites are more likely to be considered environmentally hazardous due to the use of acidic, corrosive, and carcinogenic materials that would cause concern for human habitation and interaction. There are six sites listed on the Department of Toxic Substance Control EnviroStor in the City of Yreka. None of these sites are located in the M-1 zones. There is one site listed on the California Department of Water Resources Control Board GeoTracker at 505 Foothill Drive that is in remediation for lead contamination. This site is privately held and considerably dilapidated in condition. This site would not be considered for emergency sheltering due to private property ownership and the condition of the buildings onsite.
Figure 4: Parcels Zoned Light Industrial (M-1), and Proximity Services
Section titled “Figure 4: Parcels Zoned Light Industrial (M-1), and Proximity Services”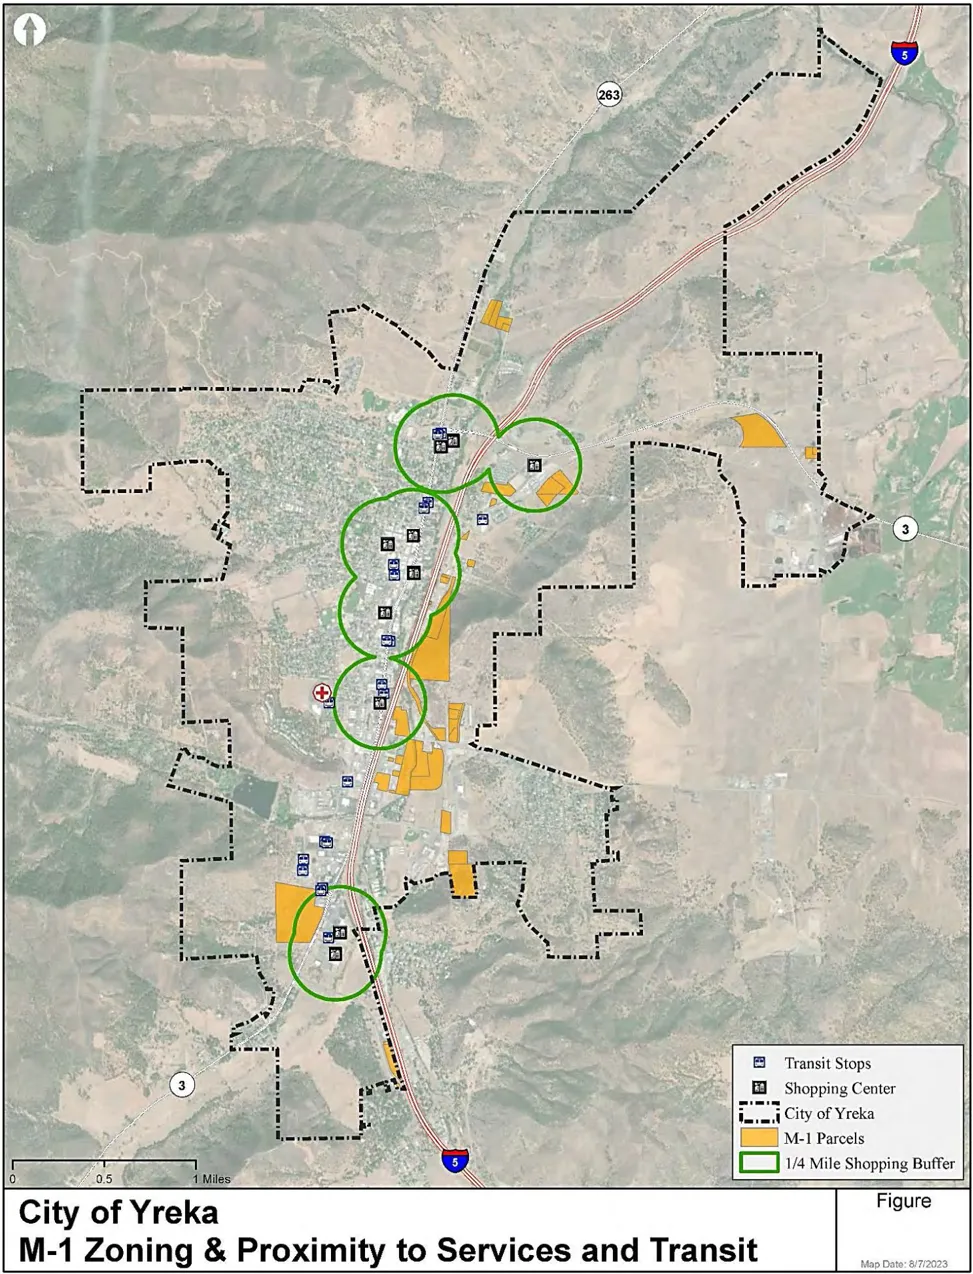
In accordance with Program HE.2.1.3 of the City’s 5th cycle element, the City amended the Zoning Code to include the statutory definition of emergency shelters, target population, and the development standards to the extent allowed by statute:
- The maximum number of beds shall be fifteen.
- The emergency shelter shall provide on-site parking at a rate of one space for staff plus one space per five allowed occupants. All applicable parking facility standards shall apply per Chapter 16.54.
- A written management plan is required for all emergency shelters that includes provisions for staff training, neighborhood outreach, transportation, security, client services, and food services.
- The maximum term of staying at an emergency shelter is six months in a consecutive twelve month period.
Although YMC limits the number of beds in a shelter, when the 15-bed limit is applied to the number of parcels that are between 0.50 and 10 acres in size (28 parcels), Yreka has a potential emergency shelter bed capacity of 420 beds. This potential capacity is nearly double the number of sheltered persons counted in the 2021 PIT as indicated in Table A-26 above. AB 139 was enacted in 2019 which established new parking standards for emergency shelters: local governments are to apply a written objective standard that provides sufficient parking to accommodate the staff working in the emergency shelter provided the standards do not require more parking for emergency shelters than other residential or commercial uses within the same zone. As part of Program HE7.1.1.5, the City will evaluate the current parking standard for emergency shelters, number 2 above, for consistency with the AB 139 standard, and advance amendments if necessary. Although the City amended the Zoning Ordinance in 2014 to permit emergency shelters in M-1 by-right, there are currently no permanent shelters operating inside City limits.
Policy HE-1.3 and Program HE-1.3.1 commit the City to encouraging infill development and adaptive reuse of underutilized industrial sites for workforce and affordable housing. As emergency shelters are permitted by-right in the M-1 zone, an industrial zoning district, Program HE-1.3.1 extends to emergency shelters, low barrier navigation centers, and other types of emergency housing in accordance with Government Code Section 65583(a)(C). Additionally, Program HE-7.4.1(2) obligates the City on a no less than annual basis to coordinate with the local non-profit housing providers, including the Karuk Housing Authority, the County’s Department of Health and Human Services, and the NorCal continuum of care to develop strategies to secure funding to develop vacant properties and to rehabilitate and convert nonresidential buildings to housing for extremely low income households and special needs households including persons experiencing homelessness. The City is already implementing these programs by supporting Siskiyou County’s Project Base Camp project for development and operation of a low barrier navigation center that will be located in the City. Additionally, the City has committed to using its formula allocation of Permanent Local Housing Allocation (PLHA) funds to develop services for homeless youth in the community.
As discussed above in section 3.3.7 above, there has been an observable increase in the number of persons experiencing homelessness in the City, although there is not an official count specific to Yreka. Existing services in the City and other nearby cities are identified in Table A-28. There is an unsanctioned camp located on undeveloped City-owned land in the vicinity of the College of the Siskiyous and Siskiyou County behavior health services. A May 2022, tent survey conducted by members of the NorCal Continuum of Care indicates there are approximately 22 tent camps at this location, with approximately 25 to 50 residents. Portable toilets and regular trash pick-up are provided to the camp. Yreka is applying for Project Homekey funds to convert a local hotel into 24 units of permanent housing and 12 pallet shelters for persons and families who are homeless or at risk. The project will make a significant positive improvement in housing.
Program HE-7.4.2 commits the City to explore whether to declare a shelter crisis pursuant to Government Code Section 8698, which may provide more options to assist people experiencing homelessness in the community. The City may consider whether the benefits of declaring a shelter crisis pursuant to Government Code Section 8698 et seq. offset the added responsibilities. Some of the benefits include:
- City immunity from liability for ordinary negligence in the provision of emergency housing
- provisions of any state or local regulatory statute, regulation, or ordinance prescribing standards of housing, health, or safety are suspended to the extent that strict compliance would in any way prevent, hinder, or delay the mitigation of the effects of the shelter crisis. A city may, in place of such standards, enact municipal health and safety standards to be operative during the housing emergency consistent with ensuring minimal public health and safety.
However, a declaration would new add new responsibilities to the City:
- Annual reporting to the State
- The obligation to develop a plan to address the shelter crisis, including, but not limited to, the development of homeless shelters and permanent supportive housing, as well as onsite supportive services. The plan must also address transitioning residents from homeless shelters to permanent housing. The plan must be developed and made available to the public by July 1 of the year following the shelter crisis declaration.
Another consideration is that the provisions of Government Code Section 8698 et seq. extend only to public facilities, meaning constructed and operating on City-owned or City-leased land which may be a limiting factor.
Transitional housing is defined in Section 50675.2 of the Health and Safety Code as rental housing for stays of at least six months but where the units are recirculated to another program recipient after a set period. It may be designated for various users including a homeless individual or family transitioning to permanent housing. This housing can take many structural forms such as group housing and multifamily units and may include supportive services to allow individuals to gain necessary life skills in support of independent living. In accordance with Program HE.2.1.3 of the City’s 5th cycle element, the City amended the Zoning Code to include the statutory definition of transitional housing. Transition housing is a by-right use in the R-A, R-1, R-2, R-3, and RPO zones. Transitional housing is not subject to standards that do not apply to other residential developments in the same zones.
Assembly Bill (AB) 101 was enacted in 2019 requires that a Low Barrier Navigation Center development be a use allowed by-right in mixed-use zones and nonresidential zones permitting multifamily uses if it meets specified requirements. of Government Code Section 65662 et seq. A low barrier navigation center is statutorily defined in Government Code Section 65660(a), and is a Housing First shelter focused on moving individuals experiencing homelessness to services and housing. Jurisdictions are to expedite navigation center applications in accordance with the statute. Although AB 101 is scheduled to sunset January 1, 2027, given the extent of California’s crisis of housing and homelessness, it would not be unexpected that the Legislature will extend the sunset date. The City does not currently comply with this requirement. Program HE-7.1.1.2 commits the City to update the zoning code to allow low barrier navigation centers by right in areas zoned for mixed use as well as nonresidential zones permitting multifamily uses.
Single-Room Occupancy Units
Section titled “Single-Room Occupancy Units”Single-room occupancy units (SROs) are often the most affordable type and may serve as an entry point for individuals who have experienced homelessness to access permanent housing. In 2014 the City adopted Ordinance No. 837 consistent with Program HE.2.1.2. SROs are defined as a compact dwelling unit with limited cooking and living facilities that is the primary residence of its occupant(s) and is within a multiple-unit structure pursuant to Section 16.12.755 Yreka Municipal Code. As indicated in Table A-49, SROs are conditionally permitted in C-2, CH and CT zones. The following minimum criteria apply to SROs:
- Tenancy. Tenancy of single-room occupancy residential units shall not be less than thirty days.
- Tenants per room. Each unit shall accommodate a maximum of two persons.
- Maximum unit size. No unit may exceed four hundred square feet.
- Common facilities. Single-room occupancy residential unit facilities shall provide individual or shared bathing facilities and may provide individual or shared kitchen facilities.
- Laundry facilities. Common laundry facilities shall be provided at a rate of one washer and dryer per ten units, with a minimum of one washer and dryer.
- Manager’s Office or Unit. An on-site management office or manager’s unit shall be provided.
- Parking. One parking space per unit is required. All applicable parking facility standards shall apply per Chapter 16.54.
- Storage. Each unit shall have a separate closet.
The City has yet to receive an application to develop an application to develop SRO units or convert an existing structure to an SRO since adoption of Ordinance No. 837. To reduce regulatory barriers for SRO development contemplated in close proximity to services, e.g., public transit and grocery stores, Program HE-7.3.1 commits the City to preparing amendments that would allow by-right SRO developments in C-2, CH, and CT zones that are within a distance a person can reasonably walk to services (e.g., a quarter mile), and that meets other applicable zoning requirements for SROs. SROs proposed at a greater walking distance will be subject to a use permit. Nonetheless, the City continues to work with non-profit providers for services and housing, to identify and develop sites for new construction SROs and conversion of existing structures.
E. Housing for Employees and Farmworkers
Section titled “E. Housing for Employees and Farmworkers”The Yreka Municipal Code distinguishes between small and large employee housing:
- Small employee housing: housing for employees for six or fewer persons in a single family home [YMC Section 16.12.447].
- Large Employee Housing: housing for employees consisting of no more than thirty-six beds in group quarters or twelve units or spaces designed for use by a single-family or household [YMC Section 16.12.445].
As shown in Table A-49, Employee Housing - Small is permitted by-right in the R-A, R-1, R-2, R-3, and RPO zones, and requires a conditional use permit in CPO, C-2, CH, and CT zones. Employee Housing - Large is permitted byright in the R-A, R-2, R-3, and RPO zones. The City requires a conditional use permit for Employee Housing Large in CPO, C-2, CH, and CT zones. The CUP process is in place to ensure compatibility with surrounding uses. Conditions of approval vary from project to project, but most likely they will contain provisions for landscaping, type of fencing, driveway locations, compatible lighting, and recreational facilities. The range of zoning districts permitting by-right small and large employee housing is greater than the zone districts permitting by-right multifamily due to inclusion of the R-A zone. Although the City’s vacant inventory contains 46 R-A zoned parcels comprising 649 acres (see Table A-46), there are only two R-A zone parcels with available water and sewer service within 100 feet of the parcel. This indicates the infrastructure development cost for Employee Housing - Large may still be high because of the small number of parcels appropriately zoned for large scale employee housing.
While the 5th cycle housing element concluded that the use permit process did not constrain the development of employee and farmworker housing, there are additional time, costs, and risk inherent to the use permit process, as discussed above. Larger employers have communicated to the City that the lack of workforce housing is a deterrent to business expansion. Program HE-2.1.4 commits the City to preparing amendments to the Zoning Code to allow small and large employee housing by-right CPO, C-2, CH, and CT zones when objective performance standards related to proximity to job centers and services are met.
AB 1783 amended the Employee Housing Act (EHA) in 2019. One of the highlights of the enacted legislation is to require jurisdictions provide streamlined, ministerial approval for qualifying agricultural employee housing developments. For an employee housing development to exercise the streamline, ministerial approval process, the site must meet a list of criteria, and one criterium is the development is located on land designated as agricultural in the applicable city or county general plan. Yreka’s General Plan and Zoning Code does not have lands designated as agricultural. The City does not have lands designated for agriculture per adopted land use regulations:
- City of Yreka General Plan 2002-2022, adopted December 18, 2003: the Land Use Element’s description of the Residential Agricultural (RA) land use designation is ‘Large lot single family residential, either by design or by incorporation of previously developed county areas. Limited agricultural use due to higher residential density than conventional agriculture’ (page 1-7).
- Yreka Municipal Code, Table 1 of Section 16.16.10 itemizes the City’s zoning districts, and there are no agricultural zoning districts listed. While the R-A allows agricultural uses in conjunction with residential uses, it is designated as a residential zoning district.
The City has determined it does not have lands designated as agricultural; therefore, the provisions of AB 1783 do not apply.
4.1.4. OTHER LOCALLY ADOPTED ORDINANCES THAT DIRECTLY IMPACT THE COST AND SUPPLY OF HOUSING
Section titled “4.1.4. OTHER LOCALLY ADOPTED ORDINANCES THAT DIRECTLY IMPACT THE COST AND SUPPLY OF HOUSING”Although the City adopted the 2010 California Building Code (CBC) for its code requirements for the construction of new housing, the City applies the current CBC and is in the process of updating local ordinance. The City deviates from the CBC only in the case of requirements for wind load and snow load (i.e., the City has a higher standard for roofing due to local conditions). Because the more stringent standards apply only in these two cases and to protect public health and safely, the application of the CBC does not pose a significant constraint to the production or improvement of housing in Yreka.
Similar to CBC, the City of Yreka uses the current City of Redding Construction Standards, although the City’s officially adopted standards are the 2007 iteration. ‘The City of Redding Construction Standards are provided for use by developers, engineers, contractors, property owners, local agencies, and operations staff to communicate the minimum and typical requirements for infrastructure within the City of Redding and area of influence’, according to the webpage (https://www.cityofredding.org/departments/public-works/engineering/constructionstandards, accessed June 29, 2022). Exceptions and modifications to Redding’s Construction Standards are adopted from time to time by the Director of Public Works of the City of Yreka regarding specific standards as needed. Although subject to change, these standards are summarized below.
- Local Streets:
Right-of-way: 50-70 feet, 60 feet typical Pavement width: 36 feet
Curb, gutter, and 4-foot sidewalk required
- Minor Arterial:
Right-of-way: 66-80 feet Pavement width: 40 feet
Curb, gutter, and 4-foot sidewalk required
- Streetlights required on public streets, but not within Planned Developments or on acre or larger lots
- Water, sewer, and fire hydrants are to be provided as required by the Director of Public Works.
- Manholes: 460-foot spacing with 12-30-inch pipe, 50-foot spacing with 33-59-inch pipe
- Curb, gutter, and a 4-foot sidewalk are required for any new building and/or improvement amounting to $20,000 or more in value. Sidewalks are 4-foot minimum in residential districts.
While all development-related improvements add to the cost of housing, it has been not been documented that the City’s adopted standards serve as a constraint to the construction of affordable housing, as evidenced by the number of affordable units that have been added to the city’s housing stock over the past ten years. It is acknowledged, however, that housing projects with units assured to be affordable typically apply for and receive funding to offset the costs associated with constructing and implementing all regulatory requirements that apply to a project. It may be more challenging to directly defray the costs associated with implementing regulatory requirements for unassisted residential development. The Housing Element includes several programs that aim to reduce the costs to development housing:
- Removing the use permit requirement for housing configured as five or more units.
- The residential technical assistance program to assist lay property owners for development of ADUs, JADUs, and SB 9 housing developments.
- Committing the City to seeking funding for an owner-occupied rehab program.
- Encouraging collaboration with Siskiyou County and the other cities to develop a regional housing trust fund.
Yreka does not have a growth control ordinance or voter-approved initiative or referendum restricting growth or capping the number of housing units. Nor does the City have a short-term rental ordinance. The City does not anticipate the need for a short-term rental ordinance because Yreka is not a visitor destination whereas other communities, especially in the southern part of the county, receive more destination tourists. A May 17, 2022, search of www.airbnb.com yielded four properties in Yreka or in proximity, and a similar search performed on May 28 th yielded nine rental properties. A similar search of www.vrbo.com on May 17, 2022, indicated there were four rental properties; then a May 28 th search indicated five available rental properties. Visually it appears some of the same properties were listed on both platforms.
4.1.5. WATER AND SEWER PRIORITY
Section titled “4.1.5. WATER AND SEWER PRIORITY”The City of Yreka is the sole provider of water and sewer service within the city and has sufficient water and sewer connections and capacity to service new development. The City does not have policies or procedures, written or otherwise, that would prevent any level of income unit from connecting to sewer and water services. Government Code Section 65589.7(a) requires cities to deliver their adopted housing elements to the water and sewer providers which are to grant priority for service connections to proposed developments that include units affordable to lower-income households. Pursuant to this statute, within thirty (30) days of adoption of its 20232031 Housing Element, the Planning Department will be internally distributed to the City of Yreka Department of Public Works, along with a summary of its Regional Housing Needs Allocation. In compliance with subparagraph (b) of Government Code Section 65589.7, this Housing Element includes program HE-1.1.3, a new program, that commits the City to establishing written policies and procedures to prioritize water and sewer connections for housing development that include lower income units within five years of adoption of the 20232031 Housing Element.
4.1.6. DENSITY BONUS
Section titled “4.1.6. DENSITY BONUS”In 2014 the City adopted Ordinance No. 837, the City’s Density Bonus Ordinance. State Density Bonus Law (SBDL), commencing at Section 65915 of the California Government Code, however, has been amended nearly annually beginning in 2017. Subparagraphs (a)(1) and (a)(3)(A) of Government Code Section 65915 obligates jurisdictions to adopt a local density bonus implementing ordinance, along with procedures and timelines for processing a density bonus application. In the event a local ordinance has not been adopted, the jurisdiction is not relieved from complying with SDBL. In accordance with Program HE-2.1.3.2.a, the City will review Ordinance No. 837 for consistency with State Density Bonus Law and will advance amendments to the City Council for adoption as needed. Since the City’s 2014 adoption of Ordinance No. 837, the City has not received any density requests from housing developers. To increase implementation of the City’s density bonus and other regulatory and financial incentives and concessions, the City will prepare and publish materials informing property owners and housing developers of the available programs for qualified housing developments in accordance with Program HE-2.1.3.3.
4.1.7. DESIGN REVIEW
Section titled “4.1.7. DESIGN REVIEW”All of the City lying within the original 1919 Yreka town site is designated historic district. Development within the district is subject to regulations that seek to balance preservation and enhancement of certain improvements that are representative of the City’s cultural, artistic, social, economic, political, architectural, and engineering history and heritage with the public health, safety and general welfare. Within the historic district, new construction and actions to remove or alter any improvement that is a designated landmark or landmark site must first obtain a permit from the City’s. The applicant’s proposal must provide evidence that the proposal would not detrimentally alter, destroy or adversely affect any exterior architectural feature, specifically emphasizes the preservation of architectural styles existing in the area of the city prior to 1910, and emphasizes other distinct and noteworthy architectural styles reflecting the phases of Yreka’s history, and for new construction the exterior will be compatible with the external appearance of other existing improvements, and will not adversely affect those nearby buildings and structures.
4.1.8. PERMITTING PROCEDURES AND PROCESS, FEES, AND TIMES
Section titled “4.1.8. PERMITTING PROCEDURES AND PROCESS, FEES, AND TIMES”A. By-Right Residential Development
Section titled “A. By-Right Residential Development”The Planning Director is delegated authority to approve, conditionally approve both single family and multifamily residential development that meets the standards for density/intensity, site development, and permitted uses of the applicable zoning district. YMC Section 16.52 - Site Plan Review identifies the required content of the site plan, standards for landscaping, and requirements for street dedications and improvements, and types of development, e.g., residential, commercial, and industrial, are subject to the requirement for Site Plan Review. The purpose of the Site Plan Review is to enable the building and planning departments to make a finding that the proposed development is in conformity with the intent and provisions of this title [Title 16] and to guide the building department in the issuance of building permits. To facilitate the Site Plan Review process, the City has developed an application form that itemizes the requirements. Housing proposals that conform with the zoning do not trigger a public hearing. According to the City’s ‘Planning Department Standard Review’ form published on their website, the typical review period is four weeks. To facilitate the Site Plan Review process, Planning staff is available for input and questions from provide applications who are developing applications. According to Planning staff, the Site Plan Review process is not a deterrent to development because staff regularly reviews and updates their public information forms, and requests feedback on possible process improvements from the applicants.
It is noted the YMC contains two notable exceptions related to nonconformity that are beneficial for residential development. First, legally created nonconforming lots (nonconforming with respect to minimum lot area, width, and/or depth) that are planned and zoned for residential uses are permitted to be developed with residential uses as provided by the zoning without the need for a discretionary permit pursuant to Section 16.59.030 YMC. Although residential development must still demonstrate conformity to the development standards of the applicable zoning district, the YMC allows nonconforming to be developed by right. Section 16.59.050 allows any existing nonconforming building or structure that is rehabilitated under a housing rehabilitation program for the benefit of low-income persons may be repaired, reconstructed, or structurally altered without being brought into full compliance with the regulations set forth in this code with regard to setbacks, off-street parking, and street improvements so long as the footprint of the existing building is not expanded.
Only development that is located within the City’s designated historic district is subject to design review, which is discussed above in Section 4.1.7.
B. Conditional Use Permit Process and Findings
Section titled “B. Conditional Use Permit Process and Findings”Residential development identified as a conditional use by the applicable zoning district requires a conditional use permit (CUP) that must be applied for and approved before the building permit can be issued. For CUP applications, the City offers applicants a courtesy Pre-Application review process to provide an initial review of preliminary or conceptual applications by interdepartmental staff. These meetings are intended to provide a better understanding of the City’s permitting processes and, through early consultation, troubleshoot project issues for potentially complex development proposals, but is not an application completeness review.
In accordance with the Permit Streamlining Act (PSA) and the California Environmental Quality Act (CEQA), all applications for discretionary housing projects are reviewed for completeness and applicability of CEQA within thirty (30) days of submittal to the City. For this phase, the City Planning Department, other City Departments, and other outside agencies, as necessary, review project application and respond with conditions of approval, any issues, or a request for additional information. The Planning Department collects issues, comments, or conditions of approval from reviewers and provides an Incomplete Letter, Complete letter, Issues Letter, and/or conditions of approval to applicant within thirty days from the date of submittal. Project applicants are also notified of the City’s preliminary CEQA determination and if the proposal may qualify for a CEQA exemption or not based on the submitted information and comments received from reviewing agencies. Submitted applications revisions restart the 30-day review clock described above.
The Planning Commission is delegated the authority to grant conditional use permits per YMC Section 16.44.040. YMC Section 16.44.020 describes the City’s CUP application and review process. According to the “Planning Department Standard Permit Review Times’ procedures published on the City’s website, all manner of CUPs take approximately four to six months to process from the date of submittal to the Planning Commission hearing. In most cases, the Planning Commission is able to conditionally approve CUPs for residential development with a single public hearing. Again, only development that is located within the City’s designated historic district is subject to design review: see Section 4.1.7 above for more information. Section 16.44.040 itemizes the finding the planning commission must make to grant a conditional use permit:
(a) The proposed use or feature, at the size and intensity contemplated and at the proposed location, will provide a development that is necessary or desirable for, and compatible with, the transportation and service facilities, the neighborhood, and the community. The following shall be considered to make this finding:
- (1) The intensity of activity in the district is not such that allowing the larger use will be likely to foreclose the location of other needed neighborhood-servicing uses in the areas; and
- (2) The proposed use will serve the neighborhood, in whole or in significant part, and the nature of the use requires a larger size in order to function; and
- (3) The building in which the use is to be located is designed in discrete elements which respect the scale of development in the district.
(b) Such use of feature as proposed will not adversely impact the health, safety, convenience or general welfare of persons residing or working in the vicinity, or injurious to property, improvements or potential development in the vicinity, with respect to aspects including but not limited to the following:
- (1) The nature of the proposed site, including its size and shape, and the proposed size, shape, and arrangement of structures, so that the subject site is physically suitable for the type, density, and intensity of the use and related structures being proposed;
- (2) The accessibility and traffic patterns for persons, non-motorized vehicular traffic, and vehicles, the type and volume of such traffic, the adequacy of proposed off-street parking and loading, and of proposed alternatives to off-street parking;
- (3) The safeguards afforded to prevent noxious or offensive emissions such as noise, glare, dust, and odor;
- (4) Treatment given, as appropriate, to such aspects as landscaping, screening, open spaces, parking and loading areas, service areas, lighting, and signs; and
- (5) Will not be injurious to property or improvement in the neighborhood.
- (c) Such use or feature as proposed will comply with the applicable provisions of this code and will not adversely affect the implementation of the general plan; and
- (d) Such use or feature are not contrary to the stated purpose of the applicable zoning district, specific plan, development regulations, and performance standards as proposed and will provide development that is in conformity with the stated purpose of the applicable zoning district, specific plan, and planned unit development.
- (e) That adequate public facilities and services, such as public access, water, sanitation, and public utilities are available to serve the site or will be made available concurrent with the proposed development.
- (f) Such use or feature as proposed will not reduce or prevent the expansion of the city’s residential unit inventory.
Once the designated hearing officer takes action on the discretionary housing permit, the City files either a notice of determination or exemption in accordance with 15075(d) or 15062(c)(2), respectively, of the CEQA Guidelines.
As discussed above in Section 4.1.2, subsection titled ‘Configuration of Multifamily Housing’, the City recognizes that the discretionary permitting process increases the costs, time, and risk to developers of multifamily housing or other types of housing that requires a CUP, which in turn diminishes the production of multifamily housing development. Programs HE-1.2.1 directs the amend the YMC to allow by-right multifamily development that is configured as more than fourplexes in R-3, R-2, and RPO zoning districts. Program HE-1.2.1 also specifies that development and performance standards of the R-3, R-2, and RPO must be objective. Program HE-1.3.3 commits the City to offering an up-zoning program to leverage SB 10 (2021). Program HE-1.3.3 also commits the City to underwriting the rezoning application and processing costs for property owners who volunteer qualifying properties for up-zoning.
C. Development and Processing Fees
Section titled “C. Development and Processing Fees”Many of the areas zoned for higher-density projects currently have on- and off-site improvements such as water and sewer connections, streets, and sidewalks in place so there are no additional requirements. For other areas, however, the City requires developers to construct improvements and/or pay fees to help deter the costs of providing infrastructure, public facilities, and services. Impact fees that apply to new residential single-family and multifamily construction are listed in Table A-51. The City also collects fees from developers to help cover the costs of planning and processing permits. Processing fees are calculated based on average staff time and material costs required to process a particular type of case. Planning and processing fees are shown in Table A-52.
Table A-51 Municipal Services, Impact, and Connection Fees
| Facility | Feeper Dwelling Unit (1) |
|---|---|
| PublicFacilities StormDrainage Parks andRecreation CitywideStreets WaterSystem WastewaterSystem | $1,510 $99 $1,821 $539 $5,132 $1,486 |
Source: City of Yreka Municipal Code, Section 11.23.090 Imposition of Fees.
(1) Fees are for informational purposes only and are subject to change.
(2) Fees as of 2013.
The City’s impact fees are somewhat higher than other small cities in the region, which have been slow to adopt or update fee programs due to declining populations. Being one of the few cities in the county to experience sustained growth, the City of Yreka’s fees for a typical 1,500-square-foot single-family are approximately $15,550, and $15,750 for a multifamily dwelling. As illustrated in 0, this typical fee total is approximately 3 percent of the average new house construction cost and 2.6 percent of the average new multifamily unit construction cost. While these costs will likely be passed on to the ultimate product consumer, thus impacting housing prices, these requirements are deemed necessary to maintain the quality of life desired by city residents.
Table A-52 Planning Permit Fees
| Fee (1) | |
|---|---|
| PreliminaryEnvironmentalReview | $50 |
| NegativeDeclaration and Mitigated Negative Declaration | $2,354.75 |
| EnvironmentalImpactReport | $3271.00 |
| County Clerk FilingNotice of Determination Processing Fee | $50 plus CDFGfees (2) |
| Annexation | $2,192 despot/cost |
| GeneralPlanAmendment | $2,192 |
| Historic District MinorExterior AlterationPermit | $145 |
| Historic District Major Exterior Alteration Permit | $2,192 |
| Rezone | $2,192 deposit/cost |
| Conditional UsePermit | $2,192 deposit/cost |
| Fee (1) | |
|---|---|
| Site Plan Review | $2,192 |
| Variance | $2,192deposit/cost |
| Property LineAdjustment | $4,661 |
| Minor Subdivision (4 or less lots) | $2,192 deposit/cost |
| Major Subdivision (5 or morelots) | $2,192 deposit/cost |
| FinalParcelMap | $4,661 deposit/cost |
| MapExtension | $200 |
| Appeals | 15% of permit or minimum of $500 |
| County Clerk Processing Fee | $50 actual cost |
Source: Yreka Planning Department 2022 Notes:
-
Fees are for informational purposes only and are subject to change.
-
In the event that a project’s effect on natural resources or wildlife is other than negligible, the California Department of Fish and Wildlife (DFW) requires an additional fee of $3,539.25 if an EIR is prepared or $2548.00 a negative declaration (DFW’s filing fees beginning January 1, 2022). These fees are subject to change, and the applicant is responsible for payment of the fees in full. If required, a permit cannot be issued until such time as the fee is paid.
Table A-53 Total Processing and Impact Fees for Typical Single- and Multifamily Units
| HousingType | TotalFees | Estimated DevelopmentCost per Unit | EstimatedProportionof FeestoDevelopment Costs per Unit |
|---|---|---|---|
| Single-FamilyUnit | $15,550 | $576,555 | 3% |
| Multifamily (per unit) | $15,750 | $612,000 | 2.6% |
Sources: www.costtobuild.net, accessed 2022 plus land costs for a 0.32 acre parcel per section 4.2.1 ‘Land Costs’ below. Estimate for Typical single-family unit estimated at 1,500 square feet. Siskiyou Crossroads, 2021
D. Permit Processing Times
Section titled “D. Permit Processing Times”The time involved in processing development applications can become a constraint to affordable housing development. In Yreka, most development applications for single-family and multifamily developments take between three and four weeks to process provided no discretionary approvals are needed. If an applicant proposes developments that require discretionary review, such as a use that requires a CUP, the processing time can extend to two months regardless of whether the development is a single-family or multifamily project. For example, the Shasta Courtyards multifamily housing development and Emerald Pointe Apartments both required use permits, each of which took approximately two months to process. Table A-54 lists the typical review times for each type of permit or approval process in Yreka. These review periods do not present constraints to development, as some review is needed to ensure the maintenance of health and safety standards. The Planning Department encourages developers to submit applications concurrently where possible to minimize the total processing time and related cost for a project.
Table A-54 Planning Processing Times
| Type of Approval or Permit | TypicalProcessingTime |
|---|---|
| MinisterialReview | 2 to 4 weeks |
| ConditionalUsePermit(CUP) | 4to6months |
| ZoneChange | 4 to 6 months |
| GeneralPlanAmendment | 6 to 18 months |
| SitePlanReview | 45 days |
| ParcelMaps | 2 to 4 months |
| InitialStudy | 6 to 8 months |
| EnvironmentalImpactReport | 12 to 18months |
Source: City of Yreka Planning Department 2022
4.1.9. BUILDING CODE AND ENFORCEMENT
Section titled “4.1.9. BUILDING CODE AND ENFORCEMENT”The City adopted the California Building Code (CBC) for its code requirements and deviates from it only in the case of requirements for wind load and snow load (i.e., the City has a higher standard for roofing due to local conditions). Because the more stringent standards apply only in these two cases and to protect public health and safely, the enforcement of the CBC does not pose a significant constraint to the production or improvement of housing in Yreka.
Code enforcement typically occurs when the building inspector is processing other permits on the site, or when complaints are filed. The Building Department staff works with the County Health Department when the complaint appears to be a matter of both health and safety.
Most complaints come from renters who have complaints against their landlord. The inspection may reveal building or health code violations that are then written up with a timeline for correction and follow-up inspections. If there are no code violations, but other non-code situations occur, the renter is given a question and answer sheet prepared by the California Department of Consumer Affairs, which helps to define the renter’s rights and options in the matter. Complaints in mobile home parks are referred to the enforcement section of HCD.
The City adopted Ordinance #770 on June 5, 2003, which establishes a process for abating public nuisances. The types of nuisances defined in the ordinance vary from unsightly storage and debris on a parcel to elements of disrepair of buildings. Enforcement of Ordinance #770 is a post-construction activity and does not constrain the development of lower-income housing.
4.1.10. ARTICLE XXXIV OF THE CALIFORNIA CONSTITUTION
Section titled “4.1.10. ARTICLE XXXIV OF THE CALIFORNIA CONSTITUTION”California Constitution, Article XXXIV (Article 34) the Public Housing Project Law is a barrier to the development of affordable rental housing in the City, and inhibits the ability of the City to partner with affordable housing developers. Article 34 was added to California’s Constitution by a voter initiative (Proposition 10) in 1950. Article 34 prevents any city or county from developing, constructing, or acquiring in any manner low-rent housing projects until a ballot measure is approved by a simple majority of qualified voters. Article 34 applies to lowincome rental projects developed by private persons or non-profits using certain types of public financial assistance, in addition to publicly-owned low-income rental projects. Article 34 significantly inhibits affordable housing development by creating uncertainty for the City and the developer, in addition to increasing administrative costs for the development of affordable housing projects. In California Finance Agency v. Elliott (1976) 17 Cal.3d 575, 588, the California Supreme Court held that where an agency ‘extensive[ly] participat[es]’ or ‘closely participates, or assists, in the development of a low-cost housing project’ it requires Article 34 authorization (81 Ops. Cal.Atty.Gen. 308 (1981)). Consequently, when a local agency or developer seeks state funding for a housing project in the City, the funding application must be accompanied by an attorney prepared legal opinion documenting how the project’s ownership, financing, agreements, and the nature and extent of involvement by the City are not subject to the local election requirement of Article 34, if the facts support this conclusion. The legal opinion must be detailed and supported by specific legal arguments grounded by the Constitution, statute and/or case law. Typically, the project proponent bears the costs associated with preparation of the opinion which may be as much as $30,000 to $50,000. While there have been several attempts to repeal Article 34 statewide, these attempts have not been successful to date. It is noted that voter passage of an Article 34 authorization does not relieve affordable housing projects from compliance with the City’s land use or building requirements or those of the state or federal oversight agencies. In other words, a jurisdiction’s general plan, zoning, and other land use regulations are not altered or diminished by a local Article 34 authorization. In the event a statewide ballot initiative to repeal Article 34 does not pass before the 2028 General Election, Program HE-1.3.6 encourages the City to advance a local ballot measure.
4.2. NON-GOVERNMENTAL
Section titled “4.2. NON-GOVERNMENTAL”4.2.1. LAND COSTS
Section titled “4.2.1. LAND COSTS”The cost of raw, developable land creates a direct impact on the cost of a new home and is considered a possible constraint. A higher cost of land raises the price of a new home. Therefore, developers sometimes seek to obtain City approvals for the largest number of lots allowable on a parcel of land. Residential land costs in Yreka as of July 2022 are shown in Table A-55. The following list of properties was gathered through Internet sites including Zillow.com. Single-family land prices ranged from $13,770 per acre to $113,028 per acre; multifamily land prices ranged from $128,947 per acre to $271,278 per acre. Although there is a wide range in price per acre, the average costs are generally higher than they were in 2013.
Table A-55 Yreka Vacant Land Costs
| Zone | Acres | Price | Price per Acre |
|---|---|---|---|
| R-1 | 0.32 | $27,755 | $86,734 |
| R-1 | 0.3 | $26,544 | $88,480 |
| R-1 | 0.14 | $16,050 | $113,028 |
| R-1 | 14.45 | $199,000 | $13,770 |
| R-3-12 | 0.38 | $49,000 | $128,947 |
| R-3-12 | 0.23 | $62,394 | $271,278 |
| R-3-16 | 0.27 | $53,493 | $198,122 |
Source: Zillow 2022
4.2.2. CONSTRUCTION AND LABOR COSTS
Section titled “4.2.2. CONSTRUCTION AND LABOR COSTS”Factors that affect the cost of building a house include the type of construction, materials, site conditions, finishing details, amenities, and structural configuration. An Internet source of construction cost data (www.costtobuild.net) estimates the cost of a single-story four-cornered home in Yreka to be approximately $366 per square foot. This cost estimate is based on a 1,500-square-foot house of good-quality construction including a two-car garage and central heating and air conditioning. The total construction costs excluding land costs are estimated at approximately $548,800 (as of June 2022), which is nearly $190,000 more than the May 2022 median home sales price in the county.
As the cost of labor or materials in Yreka continues to rise, it becomes more and more difficult to develop or rehabilitate housing in the City. This is considered a substantial constraint to the development of additional housing units.
4.2.3. AVAILABILITY OF FINANCING
Section titled “4.2.3. AVAILABILITY OF FINANCING”The cost of borrowing money to finance the construction of housing or to purchase a house affects the amount of affordably priced housing in Yreka. Fluctuating interest rates can eliminate many potential homebuyers from the housing market or render a housing project that could have been developed at lower interest rates infeasible. When interest rates decline, sales increase. The reverse has been true when interest rates increase. Over the past decade, there has been a dramatic growth in alternative mortgage products, including graduated mortgages and variable rate mortgages. These types of loans allow homeowners to take advantage of lower initial interest rates and to qualify for larger home loans. However, variable rate mortgages are not ideal for low- and moderateincome households that live on tight budgets. In addition, the availability of variable rate mortgages has declined in the last few years due to greater regulation of housing lending markets. Variable rate mortgages may allow lower-income households to enter into homeownership, but there is a definite risk of monthly housing costs rising above the financial means of that household. Therefore, the fixed interest rate mortgage remains the preferred type of loan, especially during periods of low, stable interest rates. Table A-56 illustrates interest rates as of June 2022. The table presents both the interest rate and annual percentage rate (APR) for different types of home loans. The interest rate is the percentage of an amount of money which is paid for its use for a specified time, and the APR is the yearly percentage rate that expresses the total finance charge on a loan over its entire term. The APR includes the interest rate, fees, points, and mortgage insurance and is therefore a more complete measure of a loan’s cost than the interest rate alone. However, the loan’s interest rate, not its APR, is used to calculate the monthly principal and interest payment.
Table A-56 Interest Rates
| Interest | APR | |
|---|---|---|
| Conforming | ||
| 30-yearfixed | 5.625% | 5.792% |
| 15-yearfixed | 4.625% | 4.861% |
| 5-year adjustable rate | 4.750% | 4.349% |
Source: www.wellsfargo.com, June 2022
Notes: Rates based on a $400,000 purchase price, 20% down payment, and a Good credit score of 759.
4.3. HOUSING RESOURCES AND OPPORTUNITIES
Section titled “4.3. HOUSING RESOURCES AND OPPORTUNITIES”4.3.1. EXISTING AFFORDABLE HOUSING
Section titled “4.3.1. EXISTING AFFORDABLE HOUSING”Yreka currently has eight affordable multifamily projects, with the Karuk Homes I project completed in 2017. Altogether these eight affordable housing projects provide 369 affordable units. The projects are summarized in Table A-45. Three of the projects are subsidized through HUD, and one is subsidized through the US Department of Agriculture (USDA) Rural Development Agency. HUD currently provides ‘project-based’ subsidies in Yreka through its Section 8 and Section 202 programs, and USDA Rural Development provides subsidies through its Section 515 program. The remaining three projects receive indirect government subsidies through participation in the Low-Income Housing Tax Credit (LIHTC) program administered through HUD. Although not a direct federal subsidy, LIHTC provides tax incentives for the utilization of private equity in the development of affordable housing.
In 2022 entitlements and building permits were approved for the affordable multifamily development Siskiyou Crossroads. Siskiyou Crossroads is a 50-unit multifamily complex on four acres designed for special needs and general low-income populations. All units will be affordable to the target population earning no more than 60 percent of the area median income. There will be no market rate units. Twenty-four of the units will be operated as permanent supportive housing and assisted with funding from the State’s No Place Like Home program. As Siskiyou Crossroads is under construction it is not included in Table A-57. The units are expected to be ready for occupancy by 2024.
Table A-57 Assisted Multifamily Units
| Name | Expiration Date | Total Affordable Units | Senior Units | Family Units | Funding Agency/Program |
|---|---|---|---|---|---|
| DeerCreekApts., 1060E.DeerCreekWay | 2023 | 35 | 35 | 0 | HUD, Sec.8 |
| JuniperTerrace, 800JasperWay | 2055 | 54 | 50 | 4 | USDARural Development |
| Siskiyou Valley Apts., 409BruceStreet | 2039 | 36 | 0 | 36 | USDARural Development |
| ShadowsGardenApts., 402Turre Street | 2039 | 46 | 6 | 40 | HUDSec.8;USDA Rural Development |
| Sierra Vista Retirement Ctr., 885 Sierra Vista Dr. | 2037 | 29 | 29 | 0 | HUD Sec.202 |
| ShastaCourtyards, 400Foothill Drive | 2051 | 60 | 0 | 60 | Low-IncomeHousing TaxCredit |
| EmeraldPoint Apts., 450 N. Foothill Drive | 2052 | 80 | 80 | 0 | Low-IncomeHousing TaxCredit |
| Karuk HomesI, 1832 Apsuun | 2069 | 29 | Low-IncomeHousing TaxCredit |
Source: 6th Cycle Housing Element Data Package, Siskiyou County, State California Department of Housing and Community Development, December 2021 retirement
4.3.2. ANALYSIS OF ASSISTED HOUSING PROJECTS AT RISK
Section titled “4.3.2. ANALYSIS OF ASSISTED HOUSING PROJECTS AT RISK”In 1989, the California Government Code was amended to include a requirement that jurisdictions identify and develop a program in their housing elements for the preservation of assisted, affordable multifamily units. Subsequent amendments have clarified the scope of the analysis to include units developed pursuant to inclusionary housing and density bonus programs. In the preservation analysis, localities are required to provide an inventory of assisted, affordable units that are eligible to convert within ten years of the beginning of the housing element planning period. In the City of Yreka there are currently 35 units in the Deer Creek Apartments at high risk of conversion to market rates during the 2022-2030 planning period.
4.3.3. LOSS OF ASSISTED HOUSING
Section titled “4.3.3. LOSS OF ASSISTED HOUSING”Affordability covenants and deed restrictions are typically used to maintain the affordability of publicly assisted housing, ensuring that these units are available to lower-income households in the long term. Over time, the City may face the risk of losing some of its affordable units due to the expiration of covenants and deed restrictions. If market rents continue to increase, property owners may be inclined to discontinue public subsidies and convert the assisted units to market-rate housing.
Risk was assessed based on information from the California Housing Partnership Corporation (CHPC), HUD, the California Low Income Tax Credit Committee staff, and information provided by the property managers of some properties. CHPC data indicates the federally assisted 35-unit Deer Creek Apartments is potentially at risk of conversion to market-rate housing when affordability controls expire in 2023. This project is considered at risk, which indicates that a property may convert to market rate within five years. Moderate risk is assigned to projects expected to expire within ten years of the start of the planning period (June 30, 2022). Low risk indicates that a property cannot convert to market rate for at least ten years. Although projects with agreements expiring within ten years of the beginning of the planning period are required by law to be listed, these units may not actually convert.
The Deer Creek Apartments’ affordability status may expire in 2023 according to HCD’s 6th cycle data for the Siskiyou County region. Deer Creek Apartments is a 31 unit housing development of which 29 of the units are HUD-funded project based rental assistance units. Project-based assistance is tied to particular units, and does not travel with individual tenants. This means that project-based rental assistance can be a source of long-term affordability if preserved. Therefore, advocacy to preserve units with project-based rental assistance is crucial. (https://www.nhlp.org/resource-center/project-based-rental-assistance/, National Housing Law Project, accessed July 10, 2022). The City is actively attempting to contact the property owners and management company to obtain information about their plans for the 29 assisted housing units, i.e., are they contemplating converting the units to market rate units. Property owners of federally assisted projects are required to provide notices of intent if rent subsidies will be terminated to all affected households and public agencies at six and twelve months prior to termination, unless exempted. The regulations stipulate that the City and HCD are affected agencies. Owners of government-assisted developments cannot terminate subsidy contracts, such as project-based rental assistance, without first providing an exclusive “notice of opportunity to submit an offer to purchase” to non-profit housing entities that have registered with the State. Program HE-4.2.1 commits the City to facilitating the processes to retain these 29 units as assisted units
Currently the City does not know the plans of Richfield Development for the property. The following is an analysis of the preservation and replacement options of the Deer Creek Apartments affordable housing project if the current owners do not maintain the property’s affordability status and elect to convert the units market rate units.
4.3.4. PRESERVATION AND REPLACEMENT OPTIONS
Section titled “4.3.4. PRESERVATION AND REPLACEMENT OPTIONS”A. Overview
Section titled “A. Overview”To maintain the existing affordable housing stock, the City can work to preserve the existing assisted units or facilitate the development of new units. Depending on the circumstances of at-risk projects, different options may be used to preserve or replace the units. Preservation options typically include (1) transfer of a project to nonprofit ownership; (2) provision of rental assistance to tenants using non-federal funding sources; and (3) purchase of affordability covenants. In terms of replacement, the most direct option is the development of new assisted multifamily housing units. These options are described below.
B. Transfer of Ownership
Section titled “B. Transfer of Ownership”Transferring ownership of an at-risk project to a nonprofit housing provider is generally one of the least costly ways to ensure that at-risk units remain affordable for the long term. By transferring property ownership to a nonprofit organization, low-income restrictions can be secured indefinitely and the project would become potentially eligible for a greater range of governmental assistance. The Deer Creek Apartments complex is currently owned by a development corporation and managed by a private firm out of Sacramento. As such it may benefit from being acquired by a nonprofit agency that will maintain the affordability of the units.
The current market value of the project was estimated using information from multifamily sales listings in Yreka and surrounding areas. The average cost to purchase a multifamily development was $168 per square foot. There are 35 units of approximately 750 square feet each at the Deer Creek Apartments at risk of converting to market rate within ten years. If these were purchased, the estimated cost of acquiring these would be $4,410,000.
C. Rental Assistance
Section titled “C. Rental Assistance”Rental subsidies using non-federal (state, local, or other) funding sources can be used to maintain affordability of the 35 at-risk affordable units. These rent subsidies can be structured to mirror the federal Section 8 program. Under Section 8, HUD pays the difference between what tenants can pay (defined as 30 percent of household income) and what HUD estimates as the fair market rent (FMR) on the unit. In Siskiyou County, the 2022 fair market rent is determined to be $701 for a one-bedroom unit, $922 for a two-bedroom unit, and $1,310 for a three-bedroom unit.
The feasibility of this alternative is highly dependent on the availability of other funding sources necessary to make rent subsidies available and the willingness of property owners to accept rental vouchers if they can be provided. As indicated in Table A-58, the total cost of subsidizing the rents for all 35 at-risk units is estimated at $4,130 per month or $49,560 annually.
Table A-58 Estimated Rental Subsidies Required
| Unit Size | Total Units | Fair Market Rent12 | Household Size | VeryLow Income (50% MFI)13 | AffordableCost -Utilities14 | Monthly per Unit Subsidy | Total Monthly Subsidy |
|---|---|---|---|---|---|---|---|
| 1 br | 35 | $701 | 1 | $27,300 | $583 | $118 | $4,130 |
| Total 35 | Total 35 | Total 35 | Total 35 | Total 35 | $4,130 |
Source: HUD 2022
D. Purchase of Affordability Covenants
Section titled “D. Purchase of Affordability Covenants”Another option to preserve the affordability of at-risk projects is to provide an incentive package to the owners to maintain the projects as affordable housing. Incentives could include supplementing the Section 8 subsidy received to market levels. The feasibility of this option depends on whether the complex is too highly leveraged. By providing lump sum financial incentives the City can ensure that some or all of the units remain affordable.
At current market conditions, a typical one bedroom apartment in Yreka costs approximately $800 per month plus utilities. This is $99 more than the fair market value as determined by HUD. In order to further supplement Section 8 subsidies it would cost an additional $3,465 a month for all 35 units.
E. Construction of Replacement Units
Section titled “E. Construction of Replacement Units”The construction of new affordable housing units is a means of replacing the at-risk units should they be converted to market-rate units. The cost of developing housing depends on a variety of factors, including density, size of the units (i.e., square footage and number of bedrooms), location, land costs, and type of construction. Assuming an average construction cost of $520,000 per unit15, it would cost over $18.2 million to construct 35 new assisted units. Including land costs, the total costs to develop replacement units will be significantly higher.
F. Cost Comparisons
Section titled “F. Cost Comparisons”The above analysis attempts to estimate the cost of preserving the at-risk units under various options. The cost of acquiring the Deer Creek Apartments project and transferring ownership to another nonprofit organization is high ($4.4 million). In comparison, the annual costs of providing rental subsidies required to preserve the 56 assisted units are relatively low ($49,560). However, long-term affordability of the units cannot be ensured in this manner. The option of constructing 35 replacement units is very high ($18.2 million, excluding land costs) and constrained by a variety of factors, including land costs and potential community opposition. The best option to preserve the at-risk units appears to be the purchase of affordability covenants.
4.3.5. RESOURCES FOR PRESERVING ASSISTED RENTAL HOUSING
Section titled “4.3.5. RESOURCES FOR PRESERVING ASSISTED RENTAL HOUSING”A. Organizations
Section titled “A. Organizations”The preservation of affordable rental housing at risk of conversion to market-rate housing can be assisted by nonprofit organizations with the capacity and interest in acquiring, managing, and permanently preserving such housing. HCD maintains a list of individuals and organizations that above meets the eligibility criteria as a qualified entity to participate in the Opportunity to Submit an Offer To Purchase federally-assisted multifamily rental housing projects and Right-of-First Refusal, pursuant to California Government Code Section 65863.11. Eskaton Properties Inc. of Carmichael, California, is the sole organization found on HCD’s Qualified Entities list dated December 17, 2021. The pool of qualified entities is potentially greater that represented on HCD’s list: the Shasta County and Karuk Tribe housing authorities both operate in the City, and the non-profit housing developer Rural Communities Housing Development Corporation of Ukiah, California recently secured permits for Siskiyou Crossroads.
B. Rehabilitation Program
Section titled “B. Rehabilitation Program”The City’s rehabilitation loan program is currently funded by a revolving loan account (RLA). The City applied for Community Development Block Grant (CDBG) funds in the past that were used to give rehabilitation loans. As repayments of these loans are received, the money is put back into a loan account for new applicants. Loans are made to households in target income groups (TIGs) and can be used for structural rehabilitation, room additions to relieve overcrowding, and total reconstructions. Interest rates for owner-occupied units are usually set at 3 percent but can be as low as 0 percent for very low-income households, and the life of the loan can be up to 30 years. Seven households were assisted between 2008 and 2012. The revolving fund is still in existence. The City has an interest in using the funds to provide accessible housing for those with disabilities.
C. Housing Authority
Section titled “C. Housing Authority”The State of California does not own or operate public housing; public housing is administered directly through local public housing authorities. However, for those jurisdictions that do not have a local public housing authority, HCD has a Housing Assistance Program that administers the Section 8 program in those counties.
The Shasta County Housing Authority administers the Housing Choice Voucher (Section 8) program for Siskiyou County and its jurisdictions. The program provides a voucher to recipients to use to help pay their rent for any rental unit that accepts the voucher. The recipients pay part of the rent based on 30 percent of their income, and the Section 8 program pays the remaining amount. Shasta County administers a total of 195 vouchers throughout Siskiyou County and 61 in Yreka. An additional 126 applicants are on the City of Yreka Housing Choice Voucher waiting list.
The Karuk Tribe, which owns land in Yreka, operates its own housing authority. The Karuk Tribe Housing Authority (KTHA) owns and operates single-family and multifamily housing that is available to low- and moderate-income Native Americans. Further, the KTHA administers 15 housing vouchers, which KTHA makes available to the elderly and disabled.
4.3.6. CITY OF YREKA 6th CYCLE RHNA AND HOUSING ELEMENT INVENTORY FUTURE HOUSING NEEDS
Section titled “4.3.6. CITY OF YREKA 6th CYCLE RHNA AND HOUSING ELEMENT INVENTORY FUTURE HOUSING NEEDS”Pursuant to the California Government Code Section 65584, HCD has developed a Regional Housing Need Allocation (RHNA) Plan for the Siskiyou county region. The RHNA Plan identifies a need for 20 new residential units in Siskiyou county region over an eight-year period (February 2023 to November 2030). The regional housing need for 20 units is evenly shared and distributed among the County and each of the nine cities. Each jurisdiction being allocated two housing units. As part of the RHNA Plan, HCD designates the affordability targets for the housing units. For the two housing units, the RHNA Plan identifies affordability targets of one low-income unit and one very-low income unit for each jurisdiction in the Siskiyou region. Thus, the City of Yreka’s share of regional housing needs is 2 units over the eight-year period with one unit affordable to very-low income households and the other unit designated as affordable to low income households. As discussed above in Section 3.2.2(A), as required by statute, at least 50 percent of a jurisdiction’s very low income RHNA must be categorized as ELI. In addition to the one low income unit and one very low income unit, City assigns itself one (1) ELI unit, resulting in a total of three (3) units for its 6th cycle RHNA. The City’s RHNA is presented in Table A59.
The City and the community recognize that the City’s RHNA values underestimate the actual local housing need. Yreka is not immune from the housing crisis facing most communities in California and too confronted with price and rent increases exceeding the buying power of local wages, increasing construction costs, the pace of home construction not keeping up with pace population growth, etc.
As shown in Appendix C, the City’s inventory of vacant property zoned to allow by-right multifamily is sufficient to meet the City’s 2023-2031 RHNA of one very low income housing unit and one low income housing unit, making it is unnecessary for the City to undertake a rezoning program in order to have adequate sites for new housing development. Nonetheless, in recognition that the community housing need is greater than the City’s RHNA obligation, a critical objective of the Housing Element’s Goals, Policies and Programs City is to increase the variety and affordability of housing during the Element’s eight year planning period. The sites identified in Appendix C can support the development of housing in excess of the City’s share of the 2022-2030 regional housing needs as estimated and allocated by HCD. Therefore, it can be concluded that the City has an adequate inventory of sites with supporting essential public services and facilities, to accommodate its housing needs over the 6th cycle planning period (2023-2031).
Table A-59 Regional Housing Needs Allocation City of Yreka RHNA 2022-2030
| IncomeCategory | Projected HousingNeeds | Percentageof Total |
|---|---|---|
| ExtremelyLow* | 1 | 33% |
| VeryLow | 1 | 33% |
| Low | 1 | 33% |
| Moderate | 0 | 0% |
| AboveModerate | 0 | 0% |
| Total | 3 | 100% |
Source: Siskiyou County 6th Cycle Housing Element Data Packet, December 21, 2021; Siskiyou County Final RHNA, HCD, December 2021
4.3.7. ANNEXATIONS
Section titled “4.3.7. ANNEXATIONS”According to the March 2021 Yreka Municipal Service Review, there are no active annexations within the City’s sphere of influence. Further, because the projected population growth rate is relatively low and there is an adequate supply of vacant property zoned for residential development, most new growth is expected to occur in the existing city limits (Yreka Municipal Service Review, April 2021, Siskiyou LAFCo, pg. 2-3). Additionally, the 2021 Yreka Municipal Service Review reports the most recent annexations occurred in 2009 and 2010 when 2.89 acres were annexed into the City, and a 0.52-acre strip of land was detached from the City to the Karuk Tribe. Yreka is considering annexation of the City owned parcels on Phillipe Lane immediately south of the City boundaries. This annexation would require modification of the Sphere of Influence boundary.
4.3.8. HOUSING NEEDS AND VACANT LANDS
Section titled “4.3.8. HOUSING NEEDS AND VACANT LANDS”Table A-60 summarizes the available vacant land in the City that is appropriate to meet housing needs identified by community that is beyond the City’s 6th cycle RHNA obligation, including sites that can support the development of a variety of types of housing for all income levels. As noted in Table A-60, there are a total of 82 acres of R-3 (R-3-12 and R-3-16) zoned land with the potential to result in 1,005 units; 138 acres of R-2 zoned land with the potential to result in 1,794 units; 1,177 acres of R-1 zoned land with the potential to result in 354 units; 46 R-A zoned parcels comprising 649 acres with the potential to result in 92 units; and 9.6 acres of RPO zoned land with the potential to result in 125 units.
Some of the sites listed in Table A-60 identify constraints to development. Some constraints are associated with 100-year floodplains, hillside topography, access, special-status species, and/or parcel sizes that are too small to develop without boundary line adjustments or mergers with adjacent parcels. Constraints affecting density yield are reflected in the projected realistic capacity identified in Table A-60.
Based on recent development activity in the city, a net density of 90 percent of the maximum density was assumed for most of the multifamily zoned parcels, and a net density of 50-80 percent (average 65 percent) of the maximum density was assumed for most of the single-family zoned parcels. Examples of recent multifamily projects that were developed or approved include the Siskiyou Crossroads - No Place Like Home Development. This 50-unit project is being built on 4 acres for a maximum density of 12.5 dwelling units per acre and a 100 percent buildout. There are very few large single-family residential subdivisions in Yreka with which to estimate
VI buildout densities. The most recent single-family residential subdivision that was approved in Yreka is the Liberty Hills Subdivision. This subdivision, which is situated on slopes of 12-22 percent, was approved for 16 units on 5.07 acres (including roads), for a maximum density of 3.2 dwelling units per acre and a 53 percent buildout.
In those cases where steeper slopes and/or other constraints exist, the realistic capacity of the parcels has been reduced accordingly. For example, the vacant RA zoned lands located north and east of Interstate 5 and State Route 3 are severely limited by steep slopes and Yreka phlox, a rare and endangered plant. It is estimated that this area and a small portion of RA land on steep slopes in southwest Yreka account for roughly 450 acres of the 663 acres zoned RA. Density on this acreage has typically been estimated to not exceed 0.20 units per acre (1 unit/5 acres). Similarly, the largest block of R-1 zoned land on the east side of Interstate 5 and adjacent to the easterly city limits is estimated to contain 350 acres and is very steep (30 percent slopes and greater). Further, an estimated 300 acres scattered along the westerly city boundary also contain steep slopes, typically in excess of 20 percent. Density yield on this acreage is not expected to exceed .20 units per acre. All remaining lands zoned for single- or multifamily development are located on lands with slopes typically ranging from 0 to 15 percent. The density yields on these lands will not be significantly affected by topography.
Affordable housing is permitted in a variety of residential zone districts. However, most affordable projects will occur in the R-3 zone since it permits higher densities and fits projects that are supported by government assistance. As noted above, there are a total of 83 acres of R-3 (R-3-12 and R-3-16) zoned lands with the potential to result in 1,024 units.
Public sewer and water service is readily available within 100 feet of most of the vacant lands identified in Table A-60. Water supply and sewage treatment capacity is more than adequate to serve the projected growth for the next five years and well beyond. The City’s 2022 Urban Water Management Plan (UWMP) reports an estimated population of 7,593 with a projected demand of 2,019 acre-feet per year by 2030. This is less than the actual reported use of 2,187 acre-feet in 2020. The projected 2030 demand results in a surplus of 5,781 acre-feet which indicates that the City will continue to have surplus water supply that may be used to support additional housing units. These assumptions do not include non-residential growth. In other words, even with considerably more aggressive growth assumptions than are present in the RHNA, Yreka is only expected to use 35 percent and 24 percent of available water during a normal year and single dry year, respectively. The UWMP also notes that the City’s wastewater treatment facility has the capacity to treat 1.3 million gallons per day, or 1,487 AF per year. In 2020 837 acre-feet of wastewater was processed which is approximately 56 percent of the City’s total capacity. Based on the 2022 UWMP population projections for 2030, the City is anticipated to treat less wastewater than in 2020. This also indicates there is enough treatment capacity to support additional housing units.
4.3.9. 6TH CYCLE RHNA
Section titled “4.3.9. 6TH CYCLE RHNA”While the supply of vacant and appropriately zoned property is adequate to meet the City’s 2022-2030 RHNA, the Housing Element includes programs to increase the supply of land suitable for multifamily development, remove regulatory barriers to improve opportunities to diversify the City’s housing stock with respect to affordability and housing types. Appendix C and Table A-60 identify sites that support a variety of types of housing for all income levels, including multifamily rental housing, factory-built housing, mobilehomes, housing for agricultural employees, supportive housing, single-room occupancy units, emergency shelters, and transitional housing.
4.4. FUNDING SOURCES
Section titled “4.4. FUNDING SOURCES”Many types of funding are available to the City and local nonprofit housing organizations to ensure the availability of housing affordable to low- and moderate-income persons. Appendix D lists the grant and loan options the City or other agencies can apply to fund services for residents of Yreka. There are programs to help fund the services development of multifamily rental housing, supportive housing, homeless shelters and transitional housing, firsttime homebuyer, and rehabilitation programs, second mortgages, and self-help housing. The state and federal funding programs are usually highly competitive and oversubscribed. Many of these funding programs require shovel ready projects, meaning housing projects are only eligible if all needed entitlements are in place. The application period for jurisdictions and organizations to apply for these funding programs is typically short, less than six months. The combination of these factors heightens the need for the City to consider:
- Development of local and regional funding sources, e.g., a regional housing trust fund, in collaboration with Siskiyou County, the other cities, and public housing authorities.
- Also, the need for the City to remove regulatory and procedural barriers that increase the availability of sites suitable for siting affordable housing in a variety of configurations.
4.5. OPPORTUNITIES FOR ENERGY CONSERVATION
Section titled “4.5. OPPORTUNITIES FOR ENERGY CONSERVATION”Opportunities for energy conservation can be found for both existing and future housing developments. Conservation can be achieved through a variety of approaches, including reducing the use of energy- consuming appliances and features in a home, physical modification of existing structures or land uses, and reducing the reliance on automobiles by encouraging more mixed-use and infill development and providing pedestrian access to commercial and recreational facilities.
Some energy conservation features are incorporated into the design of residential structures in Yreka due to the requirements of Title 24, which outlines measures to reduce energy consumption. These measures include lowflow plumbing fixtures, efficient heating and cooling opportunities, dual-pane windows, and adequate insulation and weatherstripping. Incorporating new technology in residential developments offers developers a chance to design projects that allow for maximum energy conservation opportunities. Although energy regulations establish a uniform standard of energy efficiency, they do not ensure that all available conservation features are incorporated into building design. Additional measures may further reduce heating, cooling, and lighting loads and overall energy consumption. While it is not feasible that all possible conservation features be included in every development, there are often a number of economically feasible measures that may result in savings in excess of the minimum required by Title 24.
Constructing new homes with energy-conserving features, in addition to retrofitting existing structures, will result in a reduction in monthly utility costs. There are many ways to determine how energy efficient an existing building is and, if needed, what improvements can be made. Many modern building design methods are used to reduce residential energy consumption and are based on proven techniques. These methods can be categorized in three ways:
- Building design that keeps natural heat in during the winter and keeps natural heat out during the summer. Such design reduces air conditioning and heating demands. Proven building techniques in this category include:
-
Location of windows and openings in relation to the path of the sun to minimize solar gain in the summer and maximize solar gain in the winter.
-
Use of ‘thermal mass,’ earthen materials such as stone, brick, concrete, and tiles that absorb heat during the day and release heat at night.
-
Use of window coverings, insulation, and other materials to reduce heat exchange between the interior of a home and the exterior.
-
Location of openings and the use of ventilating devices that take advantage of natural air flow.
-
Use of eaves and overhangs that block direct solar gain through window openings during the summer but allow solar gain during the winter.
-
Zone heating and cooling systems, which reduce heating and cooling in the unused areas of a home.
- Building orientation that uses natural forces to maintain a comfortable interior temperature. Examples include:
- North-south orientation of the long axis of a dwelling.
- Minimizing the southern and western exposure of exterior surfaces.
- Location of dwellings to take advantage of natural air circulation and evening breezes.
- Use of landscaping features to moderate interior temperatures. Such techniques include:
- Use of deciduous shade trees and other plants to protect the home.
- Use of natural or artificial flowing water.
- Use of trees and hedges as windbreaks.
In addition to these naturally based techniques, modern methods include:
- Use of solar energy to heat water.
- Use of radiant barriers on roofs to keep attics cool.
- Use of solar panels and other devices to generate electricity.
- High efficiency coating on windows to repel summer heat and trap winter warmth.
- Weather stripping and other insulation to reduce heat gain and loss.
- Use of natural gas for dryers, stovetops, and ranges.
- Use of energy-efficient home appliances.
- Use of low-flow showerheads and faucet aerators to reduce hot water use.
Major opportunities for residential energy conservation in the city will include insulation and weatherproofing, landscaping, and maximizing orientation, lowering appliance consumption, and maximizing solar energy.
The State of California offers numerous programs to assist residents with energy efficiency upgrades and renewable energy resources. Many of the programs include special financing and extended subsidies for affordable housing. Siskiyou County residents are eligible for several of these programs, including the California Solar Initiative, New Solar Homes Partnership, and Energy Upgrade California.
The following policies and programs relate to the City’s opportunities for energy conservation:
-
Policy HE-2.3 Promote the use of energy conservation measures in all housing, including very low-, low, and moderate-income housing.
-
Program HE-2.3.1.2: Promote the use of energy conservation measures in all housing through the use of public and private weatherization programs. Provide information on currently available weatherization and energy conservation programs to residents of the city. The City will have information available for the public at the front counter of City Hall and will distribute information through an annual mailing.
-
Program HE-2.3.1.3: Continue to enforce state requirements, including Title 24 of the California Code of Regulations, for energy conservation in new residential projects and encourage residential developers to employ additional energy conservation measures for the siting of buildings, landscaping, and solar access through development standards contained in the Zoning Ordinance, Building Code, and Specific Plans as appropriate.
Table A-60 By-Right Sites Available for Residential Development
| APN | Structure Value | Zoning | Residential Allowed? | Site Constraint | Acreage | Allowable Density | Water Connection | Sewer Connection | Fire Hazard |
|---|---|---|---|---|---|---|---|---|---|
| 053-611-490 | 0 | R-1 | By-Right | 0.005 | 1-6 du/ac | Avail. within 100ft | Avail. within 100ft | ||
| 054-203-130 | 0 | RPO | By-Right | Floodplain | 0.008 | 1-10 du/acc | Avail. within 100ft | Avail. within 100ft | |
| 061-061-030 | 0 | R-1 | By-Right | 0.011 | 1-6 du/ac | Avail. within 100ft | Avail. in parcel frontage | ||
| 053-151-080 | 0 | R-1 | By-Right | 0.012 | 1-6 du/ac | Avail. within 100ft | Avail. within 100ft | ||
| 053-111-280 | 0 | R-1 | By-Right | 0.013 | 1-6 du/ac | Avail. within 100ft | Avail. within 100ft | ||
| 054-121-040 | 0 | R-1 | By-Right | 0.018 | 1-6 du/ac | Avail. within 100ft | Avail. within 100ft | ||
| 054-131-270 | 0 | R-1 | By-Right | Floodplain | 0.018 | 1-6 du/ac | Avail. within 100ft to 200ft | Avail. within 100ft to 200ft | |
| 062-151-390 | 0 | R-1 | By-Right | 0.02 | 1-6 du/ac | Avail. within 100ft | Avail. within 100ft | ||
| 053-581-280 | 0 | R-1 | By-Right | 0.022 | 1-6 du/ac | Avail. within 100ft | Avail. within 100ft | ||
| 062-181-030 | 0 | RA | By-Right | 0.024 | 1 du/ac | Avail. within 100ft | Avail. outside 300ft | ||
| 053-151-020 | 0 | R-1 | By-Right | 0.025 | 1-6 du/ac | Avail. within 100ft | Avail. within 100ft to 200ft | ||
| 053-162-100 | 0 | R-1 | By-Right | 0.026 | 1-6 du/ac | Avail. within 100ft | Avail. within 100ft | ||
| 062-201-130 | 0 | R-1 | By-Right | 0.027 | 1-6 du/ac | Avail. within 100ft | Avail. outside 300ft | ||
| 053-043-100 | 0 | R-1 | By-Right | Floodplain | 0.03 | 1-6 du/ac | Avail. within 100ft | Avail. within 100ft | |
| 053-151-070 | 0 | R-1 | By-Right | 0.03 | 1-6 du/ac | Avail. within 100ft | Avail. within 100ft | ||
| 053-311-210 | 0 | R-1 | By-Right | 0.03 | 1-6 du/ac | Avail. within 100ft | Avail. within 100ft to 200ft | ||
| 053-541-450 | 0 | R-1 | By-Right | 0.03 | 1-6 du/ac | Avail. within 100ft to 200ft | Avail. within 100ft to 200ft | ||
| 053-341-370 | 0 | R-3-12 | By-Right | 0.037 | 1-12 du/ac | Avail. within 100ft | Avail. within 100ft | ||
| 053-131-350 | 0 | R-1 | By-Right | 0.039 | 1-6 du/ac | Avail. within 100ft | Avail. within 100ft | ||
| 053-191-290 | 0 | R-1 | By-Right | Floodplain | 0.04 | 1-6 du/ac | Avail. within 100ft | Avail. within 100ft | |
| 054-131-120 | 0 | R-1 | By-Right | 0.04 | 1-6 du/ac | Avail. within 100ft to 200ft | Avail. within 100ft to 200ft | ||
| 054-162-060 | 0 | R-1 | By-Right | 0.04 | 1-6 du/ac | Avail. within 100ft | Avail. within 100ft to 200ft | ||
| 054-123-040 | 0 | R-1 | By-Right | 0.045 | 1-6 du/ac | Avail. within 100ft | Avail. within 100ft | ||
| 053-341-300 | 0 | R-1 | By-Right | Floodplain | 0.047 | 1-6 du/ac | Avail. within 100ft | Avail. within 100ft | |
| 062-101-130 | 0 | R-1 | By-Right | 0.05 | 1-6 du/ac | Avail. within 100ft | Avail. within 100ft | ||
| 061-081-110 | 0 | R-1 | By-Right | 0.051 | 1-6 du/ac | Avail. within 100ft | Avail. in parcel frontage | ||
| 053-341-310 | 0 | R-3-12 | By-Right | 0.052 | 1-12 du/ac | Avail. within 100ft | Avail. within 100ft |
| APN | Structure Value | Zoning | Residential Allowed? | Site Constraint | Acreage | Allowable Density | Water Connection | Sewer Connection | Fire Hazard |
|---|---|---|---|---|---|---|---|---|---|
| 053-581-270 | 0 | R-1 | By-Right | 0.058 | 1-6 du/ac | Avail. within 100ft | Avail. within 100ft | ||
| 053-662-420 | 0 | R-1 | By-Right | 0.058 | 1-6 du/ac | Avail. within 100ft | Avail. within 100ft | ||
| 054-131-130 | 0 | R-1 | By-Right | 0.059 | 1-6 du/ac | Avail. within 100ft to 200ft | Avail. within 100ft to 200ft | ||
| 053-331-190 | 0 | R-3-12 | By-Right | 0.059 | 1-12 du/ac | Avail. within 100ft | Avail. within 100ft to 200ft | ||
| 062-151-250 | 0 | R-1 | By-Right | 0.06 | 1-6 du/ac | Avail. within 100ft | Avail. within 100ft | ||
| 053-581-250 | 0 | R-1 | By-Right | 0.061 | 1-6 du/ac | Avail. within 100ft | Avail. within 100ft | ||
| 053-532-290 | 0 | R-1 | By-Right | 0.065 | 1-6 du/ac | Avail. within 100ft | Avail. within 100ft | ||
| 054-202-080 | 0 | RPO | By-Right | Floodplain | 0.069 | 1-15 du/acc | Avail. within 100ft | Avail. within 100ft | |
| 054-123-230 | 0 | R-2 | By-Right | 0.073 | 1-13 du/ac | Avail. within 100ft to 200ft | Avail. within 100ft | ||
| 053-233-090 | 0 | R-1 | By-Right | 0.078 | 1-6 du/ac | Avail. within 100ft | Avail. within 100ft | ||
| 054-131-230 | 0 | R-1 | By-Right | Floodplain | 0.078 | no info. | no info. | ||
| 053-392-060 | 0 | R-1 | By-Right | 0.079 | 1-6 du/ac | Avail. within 100ft | Avail. within 100ft | ||
| 061-324-030 | 0 | RPO | By-Right | 0.088 | 1-10 du/acc | Avail. within 100ft | Avail. within 100ft | ||
| 054-291-350 | 0 | RPO | By-Right | 0.09 | 1-10 du/acc | Avail. within 100ft | Avail. within 100ft | ||
| 053-281-020 | 0 | RPO | By-Right | 0.092 | 1-15 du/acc | Avail. within 100ft | Avail. within 100ft | ||
| 054-081-060 | 0 | R-2 | By-Right | 0.094 | 1-13 du/ac | Avail. within 100ft | Avail. within 100ft | ||
| 054-202-110 | 0 | RPO | By-Right | Floodplain | 0.094 | 1-10 du/acc | Avail. within 100ft | Avail. within 100ft | |
| 054-173-510 | 0 | R-3-12 | By-Right | 0.095 | 1-12 du/ac | Avail. within 100ft to 200ft | Avail. within 100ft to 200ft | ||
| 053-301-330 | 0 | R-1 | By-Right | 0.099 | 1-6 du/ac | Avail. within 100ft to 200ft | Avail. within 100ft to 200ft | ||
| 053-532-260 | 0 | R-1 | By-Right | 0.1 | 1-6 du/ac | Avail. within 100ft to 200ft | Avail. within 100ft to 200ft | ||
| 053-662-100 | 0 | R-1 | By-Right | 0.1 | 1-6 du/ac | Avail. in parcel frontage | Avail. outside 300ft | ||
| 054-163-090 | 0 | R-1 | By-Right | 0.1 | 1-6 du/ac | Avail. within 100ft | Avail. within 100ft | ||
| 053-631-050 | 0 | RA | By-Right | 0.1 | 1 du/ac | Avail. outside 300ft | Avail. outside 300ft | ||
| 053-042-080 | 0 | R-1 | By-Right | 0.101 | 1-6 du/ac | Avail. within 100ft | Avail. within 100ft | ||
| 053-481-010 | 0 | R-1 | By-Right | 0.105 | 1-6 du/ac | Avail. within 100ft | Avail. within 100ft | ||
| 053-532-220 | 0 | R-1 | By-Right | 0.106 | 1-6 du/ac | Avail. within 100ft | Avail. within 100ft | ||
| 053-191-320 | 0 | R-3-12 | By-Right | 0.113 | 1-12 du/ac | Avail. within 100ft | Avail. within 100ft | ||
| 053-662-670 | 0 | R-1 | By-Right | 0.117 | 1-6 du/ac | Avail. within 100ft | Avail. within 100ft to 200ft | ||
| 054-131-250 | 0 | R-1 | By-Right | Floodplain | 0.118 | 1-6 du/ac | Avail. within 100ft | Avail. within 100ft |
| APN | Structure Value | Zoning | Residential Allowed? | Site Constraint | Acreage | Allowable Density | Water Connection | Sewer Connection | Fire Hazard |
|---|---|---|---|---|---|---|---|---|---|
| 053-072-130 | 0 | R-3-12 | By-Right | Floodplain | 0.129 | 1-12 du/ac | Avail. within 100ft | Avail. within 100ft | |
| 054-091-220 | 0 | R-1 | By-Right | 0.13 | 1-6 du/ac | Avail. within 100ft | Avail. in parcel frontage | ||
| 054-092-020 | 0 | R-1 | By-Right | 0.134 | 1-6 du/ac | Avail. within 100ft to 200ft | Avail. within 100ft | ||
| 054-092-200 | 5500 | R-1 | By-Right | 0.137 | 1-6 du/ac | Avail. within 100ft | Avail. within 100ft | ||
| 054-092-290 | 0 | R-1 | By-Right | 0.139 | 1-6 du/ac | Avail. within 100ft to 200ft | Avail. within 100ft | ||
| 054-092-300 | 0 | R-1 | By-Right | 0.14 | 1-6 du/ac | Avail. outside 300ft | Avail. within 100ft | ||
| 053-161-130 | 0 | R-1 | By-Right | 0.142 | 1-6 du/ac | Avail. within 100ft | Avail. within 100ft | ||
| 061-272-190 | 0 | RPO | By-Right | 0.146 | 1-10 du/acc | Avail. within 100ft | Avail. within 100ft | ||
| 061-321-090 | 0 | R-1 | By-Right | 0.147 | 1-6 du/ac | Avail. within 100ft | Avail. within 100ft | ||
| 053-511-240 | 0 | R-1 | By-Right | 0.148 | 1-6 du/ac | Avail. within 100ft | Avail. in parcel frontage | ||
| 061-272-110 | 0 | RPO | By-Right | 0.166 | 1-10 du/acc | Avail. within 100ft | Avail. within 100ft | ||
| 054-261-030 | 0 | R-1 | By-Right | 0.167 | 1-6 du/ac | Avail. within 100ft | Avail. within 100ft | ||
| 054-271-400 | 0 | R-1 | By-Right | 0.174 | 1-6 du/ac | Avail. within 100ft | Avail. within 100ft to 200ft | ||
| 061-011-240 | 0 | R-1 | By-Right | 0.176 | 1-6 du/ac | Avail. within 100ft | Avail. within 100ft | ||
| 053-221-020 | 0 | R-1 | By-Right | Floodplain | 0.182 | 1-6 du/ac | Avail. within 100ft | Avail. within 100ft | |
| 053-152-150 | 0 | R-1 | By-Right | 0.19 | 1-6 du/ac | Avail. within 100ft | Avail. within 100ft | ||
| 053-511-290 | 0 | R-1 | By-Right | 0.19 | 1-6 du/ac | Avail. within 100ft | Avail. within 100ft | ||
| 062-151-540 | 0 | R-1 | By-Right | 0.19 | 1-6 du/ac | Avail. within 100ft | Avail. within 100ft | ||
| 062-151-530 | 0 | R-1 | By-Right | 0.19 | 1-6 du/ac | Avail. within 100ft | Avail. within 100ft | ||
| 061-021-240 | 0 | R-3-16 | By-Right | 0.19 | 1-16 du/ac | Avail. within 100ft | Avail. within 100ft | ||
| 053-191-030 | 0 | R-1 | By-Right | Floodplain | 0.193 | 1-6 du/ac | Avail. within 100ft | Avail. within 100ft | |
| 053-132-010 | 0 | R-1 | By-Right | 0.199 | 1-6 du/ac | Avail. within 100ft | Avail. within 100ft | ||
| 062-181-240 | 0 | R-1 | By-Right | Size | 0.2 | 1-6 du/ac | Avail. within 100ft | Avail. outside 300ft | |
| 062-122-400 | 0 | R-1 | By-Right | 0.21 | 1-6 du/ac | Avail. within 100ft | Avail. within 100ft | ||
| 062-122-390 | 0 | R-1 | By-Right | 0.21 | 1-6 du/ac | Avail. within 100ft | Avail. within 100ft | ||
| 062-211-060 | 0 | R-1 | By-Right | 0.212 | 1-6 du/ac | Avail. outside 300ft | Avail. outside 300ft | ||
| 054-092-270 | 0 | R-1 | By-Right | 0.216 | 1-6 du/ac | Avail. within 100ft to 200ft | Avail. within 100ft | ||
| 053-501-360 | 0 | R-1 | By-Right | 0.22 | 1-6 du/ac | Avail. within 100ft | Avail. within 100ft | ||
| 053-651-700 | 0 | R-3-12 | By-Right | Size | 0.23 | 1-12 du/ac | Avail. within 100ft | Avail. within 100ft |
| APN | Structure Value | Zoning | Residential Allowed? | Site Constraint | Acreage | Allowable Density | Water Connection | Sewer Connection |
|---|---|---|---|---|---|---|---|---|
| 053-481-570 | 0 | R-1 | By-Right | 0.235 | 1-6 du/ac | Avail. within 100ft | Avail. within 100ft | |
| 054-231-280 | 0 | RPO | By-Right | Floodplain | 0.238 | 1-10 du/acc | Avail. within 100ft | Avail. within 100ft |
| 053-191-300 | 0 | R-1 | By-Right | Floodplain | 0.24 | 1-6 du/ac | Avail. within 100ft | Avail. within 100ft |
| 062-181-040 | 0 | RA | By-Right | 0.242 | no info. | no info. | ||
| 053-191-360 | 0 | R-1 | By-Right | Floodplain | 0.26 | 1-6 du/ac | Avail. in parcel frontage | Avail. within 100ft |
| 062-151-550 | 0 | R-1 | By-Right | 0.26 | 1-6 du/ac | Avail. within 100ft | Avail. within 100ft | |
| 062-122-320 | 0 | R-1 | By-Right | 0.26 | 1-6 du/ac | Avail. within 100ft | Avail. within 100ft | |
| 061-091-070 | 0 | R-1 | By-Right | 0.265 | 1-6 du/ac | Avail. within 100ft | Avail. within 100ft | |
| 061-021-260 | 0 | R-3-16 | By-Right | 0.27 | 1-16 du/ac | Avail. within 100ft | Avail. within 100ft | |
| 054-092-370 | 0 | R-1 | By-Right | 0.276 | 1-6 du/ac | Avail. within 100ft | Avail. within 100ft to 200ft | |
| 053-750-240 | 0 | R-1 | By-Right | 0.29 | 1-6 du/ac | Avail. within 100ft | Avail. within 100ft to 200ft | |
| 062-122-430 | 0 | R-1 | By-Right | 0.298 | 1-6 du/ac | Avail. within 100ft | Avail. within 100ft | |
| 053-191-280 | 0 | R-1 | By-Right | Floodplain | 0.3 | 1-6 du/ac | Avail. within 100ft | Avail. within 100ft |
| 053-511-030 | 0 | R-1 | By-Right | 0.3 | 1-6 du/ac | Avail. within 100ft to 200ft | Avail. within 200ft to 300ft | |
| 053-541-190 | 0 | R-1 | By-Right | 0.3 | 1-6 du/ac | Avail. within 100ft | Avail. within 100ft | |
| 062-181-300 | 0 | R-1 | By-Right | 0.3 | 1-6 du/ac | Avail. within 100ft | Avail. outside 300ft | |
| 062-122-140 | 0 | R-1 | By-Right | 0.3 | 1-6 du/ac | Avail. within 100ft | Avail. within 100ft | |
| 062-122-080 | 0 | R-1 | By-Right | 0.3 | 1-6 du/ac | Avail. within 100ft | Avail. within 100ft | |
| 061-141-050 | 0 | R-1 | By-Right | 0.3 | 1-6 du/ac | Avail. within 100ft | Avail. in parcel frontage | |
| 061-051-100 | 0 | R-1 | By-Right | 0.309 | 1-6 du/ac | Avail. within 100ft | Avail. in parcel frontage | |
| 062-201-160 | 0 | R-1 | By-Right | 0.31 | 1-6 du/ac | Avail. within 100ft | Avail. outside 300ft | |
| 054-162-050 | 0 | R-1 | By-Right | 0.31 | 1-6 du/ac | Avail. within 100ft to 200ft | Avail. within 100ft | |
| 053-152-170 | 0 | R-1 | By-Right | 0.32 | 1-6 du/ac | Avail. within 100ft | Avail. within 100ft | |
| 053-750-270 | 0 | R-1 | By-Right | 0.32 | 1-6 du/ac | Avail. within 100ft | Avail. within 100ft | |
| 053-672-450 | 0 | RA | By-Right | Size | 0.325 | 1 du/ac | Avail. outside 300ft | Avail. outside 300ft |
| 053-521-200 | 0 | R-1 | By-Right | 0.33 | 1-6 du/ac | Avail. in parcel frontage | Avail. in parcel frontage | |
| 062-211-050 | 0 | R-2 | By-Right | 0.332 | 1-13 du/ac | Avail. outside 300ft | Avail. outside 300ft | |
| 053-750-250 | 0 | R-1 | By-Right | 0.34 | 1-6 du/ac | Avail. within 100ft | Avail. within 100ft | |
| 053-750-320 | 0 | R-1 | By-Right | 0.34 | 1-6 du/ac | Avail. within 100ft | Avail. within 100ft |
| APN | Structure Value | Zoning | Residential Allowed? | Site Constraint | Acreage | Allowable Density | Water Connection | Sewer Connection |
|---|---|---|---|---|---|---|---|---|
| 053-521-180 | 0 | R-1 | By-Right | 0.35 | 1-6 du/ac | Avail. within 100ft | Avail. within 100ft | |
| 053-521-270 | 0 | R-1 | By-Right | 0.35 | 1-6 du/ac | Avail. within 100ft | Avail. within 100ft | |
| 062-151-090 | 0 | R-1 | By-Right | 0.36 | no info. | no info. | ||
| 062-122-670 | 0 | R-1 | By-Right | 0.36 | 1-6 du/ac | Avail. within 100ft | Avail. within 100ft | |
| 053-311-250 | 0 | R-3-12 | By-Right | 0.38 | 1-12 du/ac | Avail. within 100ft | Avail. within 100ft | |
| 061-311-270 | 0 | RPO | By-Right | 0.389 | 1-10 du/acc | Avail. within 100ft | Avail. within 100ft | |
| 053-491-190 | 0 | R-1 | By-Right | 0.4 | 1-6 du/ac | Avail. within 100ft | Avail. in parcel frontage | |
| 061-011-330 | 0 | R-1 | By-Right | 0.4 | 1-6 du/ac | Avail. within 100ft | Avail. within 100ft | |
| 062-211-070 | 0 | R-2 | By-Right | 0.4 | 1-13 du/ac | Avail. outside 300ft | Avail. outside 300ft | |
| 061-131-260 | 0 | R-1 | By-Right | 0.45 | 1-6 du/ac | Avail. within 100ft to 200ft | Avail. outside 300ft | |
| 054-092-380 | 0 | R-1 | By-Right | 0.472 | 1-6 du/ac | Avail. within 100ft to 200ft | Avail. within 100ft to 200ft | |
| 061-131-180 | 0 | R-1 | By-Right | 0.49 | 1-6 du/ac | Avail. outside 300ft | Avail. outside 300ft | |
| 061-131-190 | 0 | R-1 | By-Right | 0.49 | 1-6 du/ac | Avail. within 200ft to 300ft | Avail. within 200ft to 300ft | |
| 061-141-150 | 0 | R-1 | By-Right | 0.5 | 1-6 du/ac | Avail. within 100ft | Avail. within 100ft | |
| 061-201-080 | 0 | R-1 | By-Right | 0.5 | 1-6 du/ac | Avail. outside 300ft | Avail. outside 300ft | |
| 053-631-060 | 0 | RA | By-Right | 0.5 | 1 du/ac | Avail. in parcel frontage | Avail. outside 300ft | |
| 053-642-260 | 0 | RA | By-Right | 0.5 | 1 du/ac | Avail. within 100ft to 200ft | Avail. outside 300ft | |
| 053-672-300 | 0 | RA | By-Right | 0.5 | 1 du/ac | Avail. outside 300ft | Avail. outside 300ft | |
| 062-202-010 | 0 | R-1 | By-Right | 0.502 | 1-6 du/ac | Avail. within 100ft | Avail. outside 300ft | |
| 053-043-090 | 0 | R-1 | By-Right | Floodplain | 0.513 | 1-6 du/ac | Avail. within 100ft | Avail. within 100ft |
| 062-122-040 | 0 | R-1 | By-Right | 0.52 | 1-6 du/ac | Avail. within 200ft to 300ft | Avail. within 200ft to 300ft | |
| 061-131-250 | 0 | R-1 | By-Right | 0.52 | 1-6 du/ac | Avail. within 100ft to 200ft | Avail. outside 300ft | |
| 053-750-170 | 0 | R-1 | By-Right | 0.53 | 1-6 du/ac | Avail. within 100ft | Avail. within 100ft | |
| 053-750-550 | 0 | R-1 | By-Right | 0.54 | 1-6 du/ac | Avail. within 100ft | Avail. within 100ft | |
| 061-370-100 | 0 | R-1 | By-Right | 0.55 | 1-6 du/ac | Avail. within 100ft | Avail. within 100ft | |
| 061-011-140 | 0 | R-1 | By-Right | 0.57 | 1-6 du/ac | Avail. within 100ft | Avail. within 100ft | |
| 053-501-020 | 0 | R-1 | By-Right | 0.6 | 1-6 du/ac | Avail. within 100ft to 200ft | Avail. within 100ft to 200ft | |
| 061-271-030 | 0 | R-2 | By-Right | 0.629 | 1-13 du/ac | Avail. within 100ft | Avail. within 100ft | |
| 053-541-360 | 0 | R-1 | By-Right | 0.7 | 1-6 du/ac | Avail. within 100ft | Avail. within 100ft |
| APN | Structure Value | Zoning | Residential Allowed? | Site Constraint | Acreage | Allowable Density | Water Connection | Sewer Connection | Fire Hazard |
|---|---|---|---|---|---|---|---|---|---|
| 062-151-230 | 0 | R-1 | By-Right | 0.7 | 1-6 du/ac | Avail. within 100ft to 200ft | Avail. within 100ft to 200ft | ||
| 053-642-330 | 0 | R-1 | By-Right | 0.7 | 1-6 du/ac | Avail. outside 300ft | Avail. outside 300ft | ||
| 061-131-170 | 0 | R-1 | By-Right | 0.71 | 1-6 du/ac | Avail. outside 300ft | Avail. outside 300ft | ||
| 061-131-230 | 0 | R-1 | By-Right | 0.73 | 1-6 du/ac | Avail. within 100ft to 200ft | Avail. within 100ft to 200ft | ||
| 061-221-280 | 0 | R-1 | By-Right | 0.74 | 1-6 du/ac | Avail. within 100ft | Avail. outside 300ft | ||
| 053-672-210 | 0 | RA | By-Right | Size | 0.746 | 1 du/ac | Avail. in parcel frontage | Avail. outside 300ft | |
| 061-111-090 | 0 | R-1 | By-Right | Floodplain | 0.76 | 1-6 du/ac | Avail. within 100ft | Avail. within 100ft | |
| 061-071-100 | 0 | R-1 | By-Right | 0.84 | 1-6 du/ac | Avail. within 100ft | Avail. within 100ft | ||
| 061-361-140 | 0 | R-1 | By-Right | 0.9 | 1-6 du/ac | Avail. within 100ft | Avail. within 100ft | ||
| 061-131-160 | 0 | R-1 | By-Right | 0.92 | 1-6 du/ac | Avail. outside 300ft | Avail. outside 300ft | ||
| 061-091-200 | 0 | R-1 | By-Right | Floodplain | 0.95 | 1-6 du/ac | Avail. in parcel frontage | Avail. in parcel frontage | |
| 062-061-210 | 0 | R-1 | By-Right | 0.96 | 1-6 du/ac | Avail. within 100ft to 200ft | Avail. within 100ft to 200ft | ||
| 062-181-270 | 0 | R-1 | By-Right | 1 | 1-6 du/ac | Avail. within 100ft | Avail. outside 300ft | ||
| 061-091-130 | 0 | R-1 | By-Right | Floodplain | 1 | 1-6 du/ac | Avail. within 100ft | Avail. within 100ft | |
| 053-591-090 | 0 | RA | By-Right | Slope/phlox | 1 | 1 du/ac | Avail. outside 300ft | Avail. outside 300ft | |
| 053-721-090 | 0 | RA | By-Right | 1 | 1 du/ac | Avail. within 100ft | Avail. outside 300ft | ||
| 053-631-080 | 0 | RA | By-Right | 1.01 | 1 du/ac | Avail. within 100ft to 200ft | Avail. outside 300ft | ||
| 053-721-020 | 0 | RA | By-Right | 1.01 | 1 du/ac | Avail. within 100ft | Avail. outside 300ft | ||
| 053-152-160 | 0 | R-1 | By-Right | 1.05 | 1-6 du/ac | Avail. within 100ft | Avail. within 100ft | ||
| 061-091-190 | 0 | R-1 | By-Right | Floodplain | 1.09 | 1-6 du/ac | Avail. within 100ft | Avail. in parcel frontage | |
| 062-181-210 | 0 | RA | By-Right | 1.1 | 1 du/ac | Avail. within 100ft | Avail. outside 300ft | ||
| 061-361-180 | 0 | R-1 | By-Right | 1.3 | 1-6 du/ac | Avail. in parcel frontage | Avail. within 200ft to 300ft | ||
| 053-642-230 | 0 | R-3-16 | By-Right | 1.3 | 1-16 du/ac | Avail. in parcel frontage | Avail. within 100ft | ||
| 061-131-240 | 0 | R-1 | By-Right | 1.34 | 1-6 du/ac | Avail. in parcel frontage | Avail. outside 300ft | ||
| 062-181-330 | 0 | R-1 | By-Right | Floodplain | 1.4 | no info. | no info. | ||
| 053-561-230 | 0 | R-1 | By-Right | 1.45 | 1-6 du/ac | Avail. within 100ft | Avail. within 100ft | ||
| 061-201-100 | 0 | R-1 | By-Right | 1.66 | 1-6 du/ac | Avail. outside 300ft | Avail. outside 300ft | ||
| 061-131-010 | 0 | R-1 | By-Right | 2 | 1-6 du/ac | Avail. outside 300ft | Avail. outside 300ft | ||
| 061-361-130 | 0 | R-1 | By-Right | 2.1 | 1-6 du/ac | Avail. in parcel frontage | Avail. within 100ft |
| APN | Structure Value | Zoning | Residential Allowed? | Site Constraint | Acreage | Allowable Density | Water Connection | Sewer Connection | Fire Hazard |
|---|---|---|---|---|---|---|---|---|---|
| 062-181-350 | 0 | RA | By-Right | 2.23 | 1 du/ac | Avail. within 100ft | Avail. outside 300ft | ||
| 062-122-120 | 0 | R-1 | By-Right | 2.31 | 1-6 du/ac | Avail. within 200ft to 300ft | Avail. within 200ft to 300ft | ||
| 062-181-060 | 0 | RA | By-Right | 2.6 | 1 du/ac | Avail. within 100ft | Avail. outside 300ft | ||
| 061-121-040 | 0 | R-1 | By-Right | 2.7 | 1-6 du/ac | Avail. outside 300ft | Avail. outside 300ft | ||
| 053-642-090 | 0 | RA | By-Right | Slope | 3 | 1 du/ac | Avail. within 100ft to 200ft | Avail. outside 300ft | |
| 053-672-410 | 0 | RA | By-Right | 3 | 1 du/ac | Avail. within 100ft | Avail. in parcel frontage | ||
| 062-122-130 | 0 | R-1 | By-Right | 3.3 | 1-6 du/ac | Avail. within 100ft | Avail. in parcel frontage | ||
| 053-591-340 | 0 | RA | By-Right | 3.3 | 1 du/ac | Avail. within 100ft to 200ft | Avail. outside 300ft | ||
| 053-591-420 | 0 | R-1 | By-Right | 3.9 | 1-6 du/ac | Avail. within 100ft to 200ft | Avail. outside 300ft | ||
| 061-221-310 | 0 | R-3-12 | By-Right | 3.95 | 1-12 du/ac | Avail. within 100ft | Avail. within 100ft | ||
| 053-672-670 | 0 | RA | By-Right | 4 | 1 du/ac | Avail. within 100ft | Avail. outside 300ft | ||
| 053-672-030 | 0 | RA | By-Right | 5.02 | 1 du/ac | Avail. in parcel frontage | Avail. outside 300ft | ||
| 053-672-400 | 0 | RA | By-Right | 5.14 | 1 du/ac | Avail. within 200ft to 300ft | Avail. in parcel frontage | ||
| 053-642-600 | 0 | R-3-16 | By-Right | 5.53 | 1-16 du/ac | Avail. in parcel frontage | Avail. in parcel frontage | ||
| 053-642-050 | 0 | RA | By-Right | 5.728 | 1 du/ac | Avail. within 100ft | Avail. outside 300ft | ||
| 062-181-340 | 0 | RA | By-Right | 6.37 | 1 du/ac | Avail. within 100ft | Avail. outside 300ft | ||
| 061-361-090 | 0 | R-1 | By-Right | 6.6 | 1-6 du/ac | Avail. within 100ft | Avail. in parcel frontage | ||
| 053-672-320 | 0 | RA | By-Right | 8.6 | 1 du/ac | Avail. within 100ft | Avail. outside 300ft | ||
| 053-642-080 | 0 | RA | By-Right | 8.7 | 1 du/ac | Avail. within 100ft | Avail. within 200ft to 300ft | ||
| 053-591-320 | 0 | RA | By-Right | 9 | 1 du/ac | Avail. outside 300ft | Avail. outside 300ft | ||
| 061-091-160 | 0 | R-1 | By-Right | Floodplain | 10.04 | 1-6 du/ac | Avail. in parcel frontage | Avail. within 100ft to 200ft | |
| 053-711-030 | 0 | R-3-12 | By-Right | 10.5 | 1-12 du/ac | Avail. within 100ft to 200ft | Avail. in parcel frontage | ||
| 053-591-440 | 0 | R-1 | By-Right | 10.6 | 1-6 du/ac | Avail. outside 300ft | Avail. outside 300ft | ||
| 061-370-170 | 0 | R-1 | By-Right | Floodplain | 10.73 | 1-6 du/ac | Avail. in parcel frontage | Avail. in parcel frontage | |
| 053-591-360 | 0 | RA | By-Right | 11 | 1 du/ac | Avail. outside 300ft | Avail. outside 300ft | ||
| 053-591-530 | 0 | RA | By-Right | 12.1 | 1 du/ac | Avail. outside 300ft | Avail. outside 300ft | ||
| 061-201-070 | 0 | R-1 | By-Right | Slope | 13 | 1-6 du/ac | Avail. outside 300ft | Avail. outside 300ft | |
| 053-591-370 | 0 | RA | By-Right | 13.3 | 1 du/ac | Avail. outside 300ft | Avail. outside 300ft | ||
| 053-651-820 | 0 | R-3-12 | By-Right | 13.9 | 1-12 du/ac | Avail. within 100ft | Avail. within 100ft |
| APN | Structure Value | Zoning | Residential Allowed? | Site Constraint | Acreage | Allowable Density | Water Connection | Sewer Connection | Fire Hazard |
|---|---|---|---|---|---|---|---|---|---|
| 061-141-030 | 0 | R-1 | By-Right | 14.2 | 1-6 du/ac | Avail. in parcel frontage | Avail. within 100ft | ||
| 061-361-200 | 0 | R-1 | By-Right | 14.4 | 1-6 du/ac | Avail. within 100ft to 200ft | Avail. within 100ft | ||
| 061-121-060 | 0 | R-1 | By-Right | 14.45 | 1-6 du/ac | Avail. within 100ft | Avail. within 100ft | ||
| 053-672-370 | 0 | RA | By-Right | 14.48 | 1 du/ac | Avail. within 100ft | Avail. outside 300ft | ||
| 053-591-300 | 0 | RA | By-Right | 15.5 | 1 du/ac | Avail. outside 300ft | Avail. outside 300ft | ||
| 053-591-310 | 0 | RA | By-Right | 18.1 | 1 du/ac | Avail. outside 300ft | Avail. outside 300ft | ||
| 053-591-160 | 0 | RA | By-Right | 19.3 | 1 du/ac | Avail. outside 300ft | Avail. outside 300ft | ||
| 061-211-010 | 0 | R-1 | By-Right | 19.6 | 1-6 du/ac | Avail. within 100ft to 200ft | Avail. outside 300ft | ||
| 061-201-050 | 0 | R-1 | By-Right | Slope | 20 | 1-6 du/ac | Avail. outside 300ft | Avail. outside 300ft | |
| 053-672-330 | 0 | RA | By-Right | 20.4 | 1 du/ac | Avail. in parcel frontage | Avail. within 100ft | ||
| 053-672-310 | 0 | RA | By-Right | 29 | 1 du/ac | Avail. in parcel frontage | Avail. within 200ft to 300ft | ||
| 053-642-440 | 0 | R-1 | By-Right | Slope | 35.2 | 1-6 du/ac | Avail. within 100ft | Avail. within 200ft to 300ft | |
| 061-301-010 | 0 | R-1 | By-Right | Slope/Tower | 37 | 1-6 du/ac | Avail. outside 300ft | Avail. outside 300ft | |
| 053-672-260 | 0 | RA | By-Right | 39.2 | 1 du/ac | Avail. in parcel frontage | Avail. outside 300ft | ||
| 053-591-560 | 0 | R-3-12 | By-Right | 44.8 | 1-12 du/ac | Avail. within 100ft | Avail. outside 300ft | ||
| 061-201-010 | 0 | R-1 | By-Right | Slope | 45.6 | 1-6 du/ac | Avail. outside 300ft | Avail. outside 300ft | |
| 061-301-130 | 0 | R-1 | By-Right | Slope | 69.2 | 1-6 du/ac | Avail. outside 300ft | Avail. outside 300ft | |
| 062-211-080 | 0 | R-1 | By-Right | Floodplain | 81.88 | 1-6 du/ac | Avail. within 100ft to 200ft | Avail. within 100ft to 200ft | |
| 053-770-010 | 0 | R-1 | By-Right | Floodplain | 89 | 1-6 du/ac | Avail. outside 300ft | Avail. outside 300ft | |
| 062-211-020 | 0 | RA | By-Right | 93.3 | 1 du/ac | Avail. outside 300ft | Avail. outside 300ft | ||
| 053-651-810 | 0 | R-1 | By-Right | Slope | 108.61 | 1-6 du/ac | Avail. in parcel frontage | Avail. within 100ft | |
| 053-711-100 | 0 | R-1 | By-Right | Slope | 115 | 1-6 du/ac | Avail. in parcel frontage | Avail. in parcel frontage | |
| 053-651-740 | 0 | R-1 | By-Right | Slope | 134.76 | 1-6 du/ac | Avail. within 100ft | Avail. within 100ft | |
| 053-770-020 | 0 | R-2 | By-Right | 136.9 | 1-13 du/ac | Avail. outside 300ft | Avail. outside 300ft | ||
| 053-631-070 | 0 | RA | By-Right | 140.39 | 1 du/ac | Avail. within 100ft | Avail. outside 300ft | ||
| 053-770-030 | 0 | R-1 | By-Right | 141 | 1-6 du/ac | Avail. outside 300ft | Avail. outside 300ft |
Figure 5: Map of Yreka’s Sites available for By-Right Residential Development
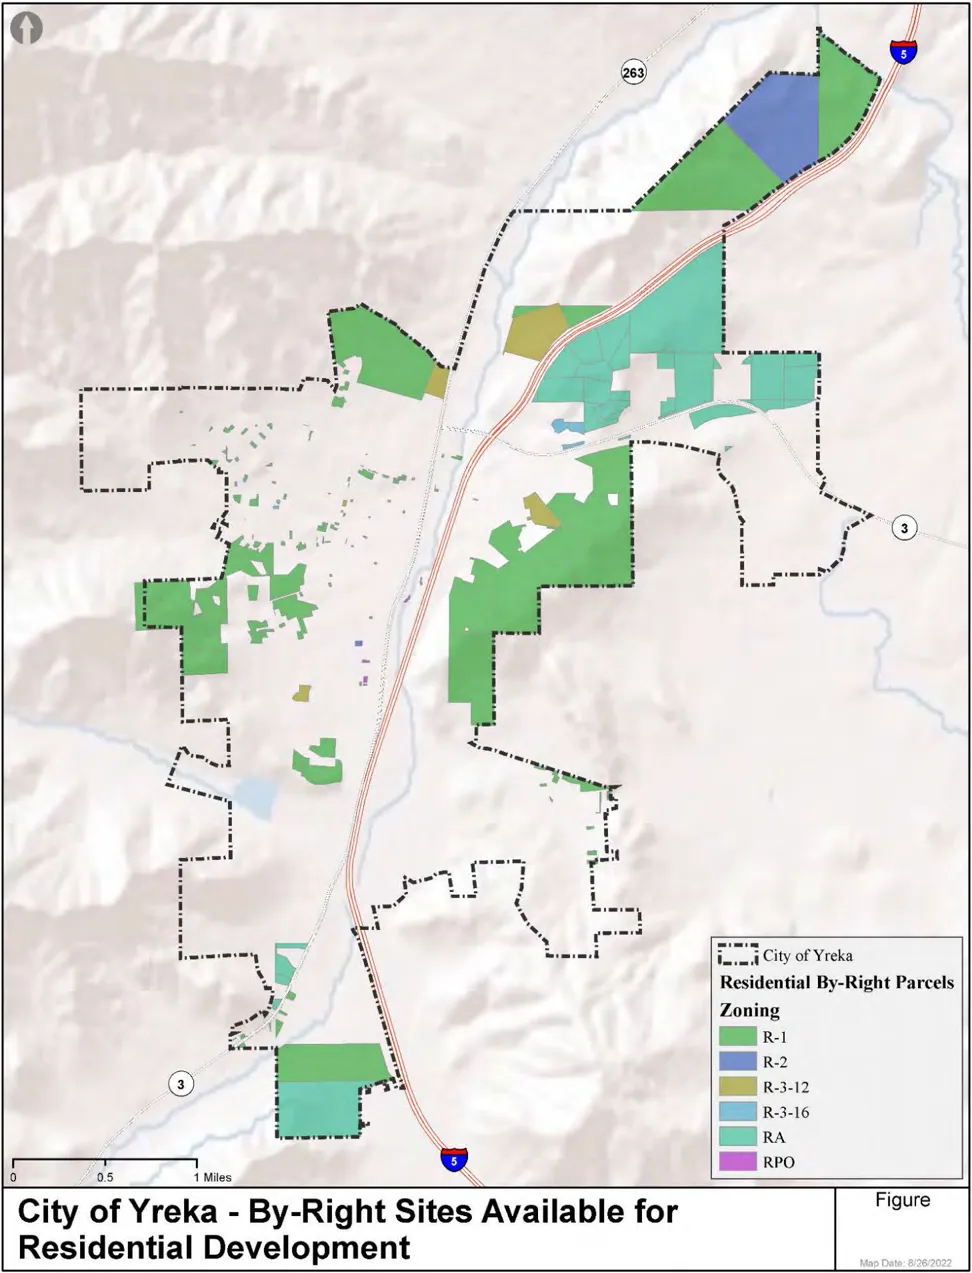
Household, family, Size of
Section titled “Household, family, Size of”The term “size of household” includes all the people occupying a housing unit. “Size of family” includes the family householder and all other people in the living quarters who are related to the householder by birth, marriage, or adoption.
Household, nonfamily
Section titled “Household, nonfamily”A nonfamily household consists of a householder living alone (a one-person household) or where the householder shares the home exclusively with people to whom he/she is not related.
Appendix B - ASSESSMENT OF FAIR HOUSING
Section titled “Appendix B - ASSESSMENT OF FAIR HOUSING”Public agencies, which includes all cities and counties, have the duty to affirmatively further fair housing (AFFH) as part of the agency’s activities and programs relating to housing and community pursuant to Government Code Section 8899.50 et seq. This is an ongoing and continual obligation. Enactment of Assembly Bill 686 (2017) takes the AFFH duty further by requiring all housing elements due to be revised on or after January 1, 2021, contain an assessment of fair housing practices, an analysis of the relationship between available sites and areas of high or low resources, and concrete actions in the form of programs to affirmatively further fair housing. A housing element must contain AFFH components for:
Public Outreach: A diligent effort in the public participation process to include all community stakeholders, including individuals and organizations in the city and the region who represent lower income households, people in protected classes, and households with special needs.
Conduct an Assessment of Fair Housing: The housing needs assessment is to include an analysis of fair housing issues, existing patterns and trends of segregation and inclusion, and current fair housing issues. In the context of AFFH, segregation means there is a high concentration of persons of a particular race, color, religion, sex, familial status, national origin, or having a disability or a type of disability in a particular geographic area when compared to a broader geographic area.
The Housing Element Land Inventory: The City’s inventory of available sites must be evaluated for consistency with affirmatively furthering fair housing. The analysis must include how particular sites will meet the needs of all households, and how segregated living patterns will be replaced by integrated and balanced patterns, transforming racially and ethnically concentrated areas of poverty to areas of opportunity.
Housing Element Programs: Explicitly address, combat, and relieve disparities resulting from past and current patterns of segregation to foster more inclusive communities, address disparities in housing needs and access to opportunity, and foster inclusive communities.
In April 2021, the Department of Housing and Community Development (HCD) released its Affirmatively Furthering Fair Housing Guidance for All Public Entities and for Housing Elements (Guidance). In the Guidance, Affirmatively Furthering Fair Housing (AFFH) is defined as “meaningful actions, in addition to combating discrimination, that overcome patterns of segregation and foster inclusive communities free from barriers that restrict access to opportunity based on protected characteristics.’ A key component of AFFH is the assessment of fair housing. This evaluation identifies the factors that contribute to segregation, disparities in access to opportunity, and disproportionate housing needs that may be occurring in a community, which in turn informs the priorities and the actions a jurisdiction needs to take to promote integration in the Goals, Policies, and Programs section.
The City of Yreka is covered by 3 census tracts that intersect Yreka city limits and extend beyond the city limits. The three census tracts are further subdivided into nine block groups that extend outside Yreka city limits. While there are 263 census blocks in Yreka, the available data at this level are limited to population and household counts, and racial and ethnic demographics. Fair housing data that is specific to the City of Yreka and Siskiyou county are limited. Data specific to the City and Siskiyou County has been included where available from the U.S. Census, American Community Survey (ACS), and the HCD AFFH Data and Mapping Resources Tool.
1. REGULATORY BACKGROUND AND AFFH SETTING
Section titled “1. REGULATORY BACKGROUND AND AFFH SETTING”Limited housing choice and access experienced by people within protected classes, such as race, sexual orientation, or disability, have far-reaching impacts on access to job opportunity, quality education, and mental and physical health. Residential segregation and exclusion, whether by race, ethnicity, disability, or income, is a result of numerous housing policies, practices, and procedures-both public and private-that have had enduring and pervasive negative impacts. (Guidance, pg. 5). The June 2020 analysis of fair housing impediments prepared by the state of California identified ten impediments to fair housing choice in the state (Executive Summary, Final 2020 Analysis of Impediments to Fair Housing Choice (ca.gov), accessed December 30, 2022, pg. 9):
- Supply and Production of Affordable Homes: Inadequate supply and production of affordable homes available to low-income households and persons in protected classes.
- Housing Preservation: Vulnerable supply of affordable housing stock threatens housing options for lower-income and protected households.
- Housing Instability and Homelessness: Unequal access to supportive services, shelter, and affordable housing opportunities increases risk for persons experiencing homelessness, especially protected classes. The Coronavirus pandemic has exacerbated existing inequalities and vulnerabilities.
- Fair Housing Education and Enforcement: Limited community awareness of fair housing protections and enforcement resources.
- Tenant Protections and Anti-Displacement: Lack of uniform enforcement and adequate antidisplacement protections have left protected classes, such as communities of color, more vulnerable to displacement.
- Disparities in Housing Quality and Infrastructure: Low-income households, rural communities, and persons in protected classes, are disproportionately experiencing severe housing problems, a lack of adequate housing options, and disparities in infrastructure.
- Climate and Environmental Vulnerabilities: Low-income households and protected classes are often disproportionately impacted by climate change, environmental injustice, or unsustainable land use and development practices.
- Historic and Lasting Impact of Segregation: Despite the repeal of explicitly racist and discriminatory housing laws, there remains a lasting legacy of segregation and resources disparities. Housing choice is often limited for persons of protected classes, including communities of color, to segregated concentrated areas of poverty.
- Local Resistance and Exclusionary Land Use Policies Constrain Access to Opportunity: Denying, preventing, or rendering infeasible multifamily housing development, alternative housing strategies, and affordable housing limits access for low-income households, protected classes, and persons experiencing homelessness.
- Insufficient Accessible Housing Stock: Lack of adequate accessible housing options, specifically for persons with mobility and sensory disabilities, limits housing choice for low-income households and people with disabilities.
The City of Yreka is located in Siskiyou county, in northern California. Siskiyou county is 4.06 million acres in size, of which less than 13,000 acres are urbanized. Siskiyou county has a total population of 44,076, making Siskiyou county rural with a low population density. The elevation of Siskiyou County ranges from 520 feet to 14,179 feet at Mt. Shasta. The county encompasses parts of five National Forests, six scenic rivers (Klamath, Sacramento, Salmon, Scott, Shasta and McCloud) as well as numerous lakes, streams and creeks, that providing numerous and a variety of recreation opportunities. There are eight incorporated cities in Siskiyou county. The seat of Siskiyou county government is in Yreka. Montague is the city located closest to Yreka, and is about seven miles east of Yreka. Yreka is approximately 10 square miles in size. As of the 2020 Census, Yreka had a population of 7,807 individuals.
Interstate 5 bisects Yreka in a north-south direction. Siskiyou Transit and General Express (STAGE) provides regional bus service that largely follows the Interstate 5 corridor with most stops located on or near Route 263. There are 13 STAGE stops in Yreka. The city of Yreka does not operate a separate intracity bus service. This results in little to no transit service for neighborhoods that are east of Interstate 5. Madrone Hospice provides transportation for seniors 60 years or older. There is no rail service available in Yreka, although there is an intercity Amtrak route with a designated stop in the city of Dunsmuir, located approximately 46 miles south of Yreka.
The Yreka Union Elementary school district operates three schools: one transitional kindergarten, two elementary schools. Approximately 70 percent of students are eligible for the Free Lunch and Reduced-Price lunch programs, although none of the schools are indicated to be Title 1 schools.16 Yreka Union High district operates two schools. Approximately 52 percent of students are eligible for the Free Lunch and Reduced-Price lunch programs, although neither of the District’s schools are indicated to be Title 1 schools.16 All of these are public schools providing primary education to school-age residents of the Yreka and the surrounding area. All of the school campuses are located west of Interstate 5 and in proximity to the historic Downtown. College of the Siskiyous is a public community college with a second campus in the city of Weed. College of the Siskiyous is part of the California Community Colleges System, and is the northernmost college in California, and is the only college in Siskiyou County.
As discussed in Appendix A, Section 3.3.2, the City has an existing reasonable accommodation procedure that makes verbal and written requests available to residents with disabilities.
During the 5th housing element cycle, the city experienced significant staff turnover and has had issues with recruitment and retention. Many of the current staff have been working with the City for less than a year. This diminished the City’s ability to make significant progress of the Goals, Policies, and Programs set forth in the previous Housing Element update. A number of devasting wildland fires have occurred in the region in recent years resulting in the loss of hundreds of homes, many of which have not been rebuilt. Within Yreka in a two year period from May of 2020 through May 2022, there were:
- 16 structure fire calls, although not all were major,
- 48 vegetation or wildfires (again, this could be very small to small spot fire to half acre) and
- Major fires in 2020 and 2022. The 2020 fire was within 10 miles of Yreka and was 450 acres in size. The 2022 McKinley fire triggered evacuations of residents in the western portions of the City.
A result of the wildfires in the region is Yreka’s ISO rating has been downgraded from a 3 to a 4, although the City plans to appeal this decision. One outcome of the downgrade is dramatic fire insurance rate increases. New fire insurance rates for homes located in the City are anticipated to be $2,000 to $4,000 annually, depending on the size and location of the residence. These new rates are about double the previous rates. During the early public input process, the City heard of several occurrences of home buyers, including first time homebuyers, being unable to purchase homes due to the cost of fire insurance. As discussed further below, Yreka is considered a low-income community because the median income is 80 percent or less of the statewide median income, as such current homeowners may not be able to afford premium increases resulting in underinsured homes for fire. Underinsured homes may increase the risk of displacement if homeowners are unable afford to rebuild in the event of fire and a catastrophic loss.
As shown in Table A-28 of Appendix A, in 2019 the City of Yreka has a vacancy rate of 1.5 percent for rental units and there were no vacant ownership units. The 2019 vacancy rates are consistent with 2000 and 2010 rates, with the rate for rentals decreasing from 3 percent in 2000 to 2019’s rate of 1.5 percent. These are extremely low vacancy rates. As presented in Table A-27 in Appendix A, detached single family units make up 61 percent of the City’s housing stock, and nearly 60 percent of the housing units are owner occupied. The combination of extremely low vacancy rates, the fact that detached single family detached are the most common type of housing unit, and that most units are owner occupied indicates little room for mobility and high demand for the affordable units there are.
Generally, Yreka’s existing industrial areas are located in the southwest portion of town and east of Interstate 5. This area experiences heavy commercial truck traffic in this area. According to the City staff, housing condemnations are more common in the eastern portions of the city.
1.1. KARUK TRIBAL LANDS
Section titled “1.1. KARUK TRIBAL LANDS”Yreka is within the designated service area of the Karuk Tribe, a federally and state recognized tribe, that has 3,751 Enrolled Tribal Members as of 2020, making the Karuk Tribe is the second largest tribe in California.17 The Bureau of Indian Affairs designates the entirety of Siskiyou county and an eastern portion of Humboldt County as the Karuk Tribe’s Service Area, which corresponds with the Karuk Tribe’s ancestral territory.18 The Karuk Tribe does not have a reservation because their treaties were not ratified by the U.S. Congress.17 Beginning in the late 1970s the Tribe began purchasing and assembling land in Orleans, Happy Camp, and Yreka, and has approximately 914 acres of Trust land, and 822 acres of Fee land as of 2020.17 The lands are highly dispersed and separated by great distances. The Tribe has land use authority of lands that are held in Trust, and Trust lands are not subject to the local government’s land use regulations. Lands that the Tribe holds in Fee, however, are subject to the local government’s land use regulations.
Approximately 652 acres of Tribal Fee and Trust land are within Yreka’s city limits, most of this land is located at the southeast corner of Yreka city limits and shown in Figure 1A. One hundred forty-six (146) housing units for tribal members have been developed on this land. Thirty of those residences, referred to as Karuk Homes I, were built using 2015 allocation of $874,302 in federal tax credits and $3,409,157 in state tax credits from the California Tax Credit Allocation Committee (CTCAC) that were award to the Karuk Tribal Housing Authority.19 Tax credits helped finance the construction of 30 new single-family homes (29 Housing Credit homes and one manager’s home). The Karuk Homes I development includes a mix of homes with three bedrooms at 1,918 square feet; four bedrooms at 2,004 square feet; and five bedrooms at 2,750 square feet. Three homes are targeted to households with annual incomes up to 30 percent of Area Median Household Income (AMI), eight homes are targeted for households up to 40 percent AMI, twelve homes are targeted for households up to 50 percent AMI, and six homes are targeted for households up to 60 percent AMI, with all units being affordable to lower income households who are Karuk Tribal members. The Karuk Tribe has an active and experienced tribal Housing Authority with offices in Yreka and Happy Camp. The Karuk Tribal Housing Authority (KTHA) has a portfolio of more than 180 affordable homes that they have developed and manage.
Nearby, the Karuk Tribe operates the Rain Rock Casino, which is also within the Yreka city limits and east of Interstate 5. There are two parcels that are trust land located on South Oregon Road in the Fairchild Medical
Center neighborhood that is west of Interstate 5. These two parcels are used as health clinics and are fully developed, and are not shown on Figure 1A. The Casino is a source of employment for Karuk tribal members and residents of Yreka.
Karuk Tribal representatives and City officials meet every other month to discuss housing needs, economic development, management of infrastructure, health services, and other opportunities to collaborate and partner for the benefit of the City and the Tribe.
1.2. YREKA NEIGHBORHOODS
Section titled “1.2. YREKA NEIGHBORHOODS”For purposes of the AFFH analysis, the City has identified the following neighborhoods and a summary description of the neighborhood’s existing land use and land use patterns follows.
-
Downtown: Yreka’s historic downtown generally occupies the northwest portion of the City and is west of Interstate 5. This portion of the City has denser residential development, with most residential structures configured as detached single family residences. There are more city parks and other public amenities located in this portion of the City. While there are commercial uses, there are fewer heavy commercial uses, and industrial uses are not present. Most of the public schools are located in this area.
-
The Karuk Tribal lands and associated Tribal housing development as shown in Figure 1A and discussed above in section 1.1.
-
Campbell Tract Neighborhood: This neighborhood abuts the Karuk Tribal lands to the north and east. The housing units are mostly configured as detached single family residences. Density in this neighborhood mixed, with some portions having a density similar to that seen in the Downtown, while other portions have low density with large lots. While there may be home-based business operating in this neighborhood, traditional brick-and-mortar commercial uses are not present in this this neighborhood.
-
The Greenhorn Park neighborhood includes the namesake City park, and the geographic area south of Greenhorn Road and west of Interstate 5. East of the park are heavy commercial uses, visitor serving uses, and government facilities, i.e., Klamath National Forest Headquarters, Social Security Administration, and the Yreka campus of College of the Siskiyous. Further south along State Route 263, there are low density residential uses near the boundary of the Yreka city limits.
-
Fairchild Medical Center Neighborhood: In addition to the Fairchild Medical Center, a critical care facility, Fairchild Medical Center neighborhood features the Oakridge retirement community, a mobilehome park. Other land uses are a mix of light and heavy commercial uses especially adjacent to State Route 263.
-
Southeast Neighborhood: The neighborhood on the east side of Interstate 5 and in the vicinity of the City’s southeastern boundary are commercial and heavy commercial uses that parallel Interstate 5. The commercial uses transition to low density residential uses moving east away from Interstate 5.
-
North Foothill Drive Neighborhood: The neighborhood in the northeast of the City that generally parallels North Foothill Drive features a mix of an established single family neighborhood, and four multifamily developments. There are commercial and heavy commercial uses also present in this neighborhood. Also, the Yreka RV Park is located in this neighborhood and provides RV spaces for visitors, and offers park model units for long term rental.
All four multifamily developments are income restricted and affordable developments via Low-Income Housing Tax Credits, HUD Section 202 funding, and/or USDA’s Section 515 rural rental housing program (for more details see Appendix A, Section 4.1.2, and Table A-57):
- Sierra Vista Retirement Center. The Sierra Vista Retirement Center offers 29 affordable units for seniors via. All of Sierra Vista’s units are income restricted. The units are configured as detached units.
- The Juniper Terrace apartments are located at the City’s eastern boundary, and are northeast of the Sierra Vista Retirement Center. The Juniper Terrace apartments has 55 units, with one and two bedroom units, and is an affordable housing development. One hundred percent of the units are income restricted via low-income housing tax credits and.
- Shasta Courtyards: 60 units. 100 percent of Shasta Courtyards’ units are affordable and are not age restricted. Units are configured as one and two bedroom units.
- Emerald Pointe: 80 units. 100 percent of Emerald Pointe’s units are affordable and are set aside for seniors. Units are configured as one and two bedroom units.
-
Oberlin-Center Neighborhood: The area east of Interstate 5, lying between East Oberlin Road and East Center Street is largely undeveloped with residential uses; a review of Google Map imagery indicates there are approximately five housing units in this neighborhood. The dominant land uses in this area are heavy commercial, industrial, and a cemetery.
1.3. COMPLIANCE WITH EXISTING FAIR HOUSING LAWS AND REGULATIONS
Section titled “1.3. COMPLIANCE WITH EXISTING FAIR HOUSING LAWS AND REGULATIONS”Government Code § 65008 covers actions of a city, county, city and county, or other local government agency, and makes those actions null and void if the action denies an individual or group of individuals the enjoyment of residence, landownership, tenancy, or other land use in the state because of membership in a protected class, the method of financing, and/or the intended occupancy. The City encourages housing developments of all types, regardless of size, prospective tenant, or financing source, and supports by-right development in residential zones.
Government Code § 8899.50 requires all public agencies to administer programs and activities relating to housing and community development in a manner to affirmatively further fair housing and avoid any action that is materially inconsistent with its obligation to affirmatively further fair housing. While City practices reflect this goal, the City has yet to adopt a policy or ordinance committing to this goal. As part of Program HE-3.1.1, the city is committed to annually reporting on whether the desired outcomes of its AFFH programs are being achieved, and to make adjustments to increase goal obtainment.
Government Code § 11135 et seq. requires full and equal access to all programs and activities operated, administered, or funded with financial assistance from the state, regardless of one’s membership or perceived membership in a protected class. The City adheres to these mandatory requirements when applying for and administering state programs.
Density Bonus Law (Government Code § 65915.). In 2014, the City adopted amendments to its density bonus provisions, Chapter 16.78 of Title 16, Yreka Municipal Code, to be consistent with that iteration of State density bonus law (SDBL). Since 2014 SDBL has received numerous substantive updates. Program HE-2.1.3 commits the City to updating its existing regulations to be consistent with SDBL. As presented in Chapter 3 which reviewed the effectiveness of the City’s 5th cycle housing element, the City received one application for the construction of 50 lower income housing units in the planning period (Siskiyou Crossroads, 2021) but the project proponent did not request a density bonus. While The City actively promotes the construction of new housing and will process all housing applications. Overall, during the 5th cycle there was limited opportunities to implement the City’s existing density bonus regulations due to low levels of application/permit activity.
Housing Accountability Act (Government Code § 65589.5.). The City Planning staff is familiar with recent amendments to the Housing Accountability Act, and actively monitors, no less than annually, online resources for legislative updates. Yreka is a member of the California League of Cities and receives legislative updates distributed by the League, which includes amendments to the Housing Accountability Act amongst others.
No Net Loss Law (Government Code § 65863). This housing element meets No Net Loss (NNL) requirements by providing capacity sufficient to meet the RHNA plus a minimum buffer of 20 percent additional capacity in all income categories. As compliance with NNL requires transactional review of development applications, both ministerial and discretionary, Program HE-1.1.1 memorializes and commits the City to conducting this review on a project-by-project basis, and to take the actions as required by State law should an inventory deficit as defined in NNL law. Additionally, Program HE-1.1.2 commits the City to annually reviewing the status of its inventory and project whether a deficit may occur. Should a deficit be anticipated, the City will take steps to change the General Plan and zoning as needed to increase the amount of available land.
Least Cost Zoning Law (Government Code § 65913.1). As shown in the sites inventory of this housing element, the City has designated and zoned sufficient vacant land for residential use with appropriate standards in order to accommodate all income categories identified by the RHNA.
Excessive subdivision standards (Government Code § 65913.2.). The City complies. The City has no policies, ordinances, or recent practices that impose design controls or public improvement standards for the purpose of rendering development infeasible. Further, the City considers the effect of ordinances adopted and actions taken on the housing needs of the region.
Limits on growth controls (Government Code 65302.8.). The City does not currently impose growth controls or growth management practices.
2. PUBLIC OUTREACH
Section titled “2. PUBLIC OUTREACH”As described Chapter 1, Introduction, the City engaged community members and stakeholders in several venues. The information obtained through public meetings, surveys, and stakeholder interviews, including the regional continuum of care, provide insight to the true needs of the community. More specifically, the City coordinated with the Continuum of Care network through Siskiyou County Health and Human Services during the process to engage the persons experiencing homelessness. The City interviewed caregivers, homeless youth programming staff, and received input from the individuals who are homeless. While the City’s RHNA may be low, the actual need of the community may be much greater. Through the public participation process the City can identify what issues and obstacles people may be experiencing when trying to find housing.
3. ASSESSMENT OF FAIR HOUSING
Section titled “3. ASSESSMENT OF FAIR HOUSING”California Government Code Section 65583 (10)(A)(ii) requires the City of Yreka to analyze areas of segregation, racially or ethnically concentrated areas of poverty, disparities in access to opportunity, and disproportionate housing needs, including displacement risk. HCD’s Guidance document defines these terms to mean:
-
Disparities in Access to Opportunity: Defined by the AFFH Final Rule as ’substantial and measurable differences in access to educational, transportation, economic, and other opportunities in a community based on protected class related to housing.
-
Disproportionate Housing Needs generally refers to a condition in which there are significant disparities in the proportion of members of a protected class experiencing a category of housing need when compared to the proportion of members of any other relevant groups, or the total population experiencing that category of housing need in the applicable geographic area. For purposes of this definition, categories of housing need are based on such factors as cost burden, severe cost burden, overcrowding, tenure (own vs. rent), homelessness, and substandard housing conditions.
-
Segregation generally means a condition in which there is a high concentration of persons of a particular race, color, religion, sex, familial status, national origin, or having a disability or a type of disability in a particular geographic area when compared to a broader geographic area.
In most cases, Siskiyou county is used for regional comparison. State Highway 263 consistently shows up as a line of separation across numerous fair housing indicators. Generally, populations residing east of Highway 263 are more likely to live below the poverty line and less likely to own their homes.
It is noted that the City of Yreka is not identified in the 2020 and 2021 TCAC mapping as an area of high segregation and poverty. There are mapped areas of high segregation and poverty in northwest and northeast Siskiyou County, however, these areas are outside the City limits and are not adjacent to the City. There are no racial and ethnic areas of concentrated poverty (R/ECAP) in the City or Siskiyou county. There are no areas in Yreka that were identified in the homeowners loan corporation (HOLC) redlining grade created during the New Deal Era, a federal government sponsored program that implemented housing segregation and discrimination.
3.1. INTEGRATION AND SEGREGATION PATTERNS
Section titled “3.1. INTEGRATION AND SEGREGATION PATTERNS”This section describes potential segregation patterns and trends as it relates to race and ethnicity, disability, familial status, income, and poverty. Where available, data from the ACS is mapped by census block groups to show the geographic distribution of each variable. To assess where there may be geographic patterns of segregation and integration, the City analyzed four characteristics: race and ethnicity, disability, income, and familial status.
3.1.1. RACE AND ETHNICITY
Section titled “3.1.1. RACE AND ETHNICITY”Table B-1 below summarizes Yreka’s race and ethnicity as of the 2010 and 2020 Census, along with Siskiyou county. For both decennial censuses, Whites who are not Hispanic or Latino are the largest ethnic group, with persons who are Hispanic or Latino comprising the next largest ethnic group in Yreka. Racially, Whites alone are the largest racial group, with American Indian and Alaska Natives being the second largest racial group. As shown in Table B-1, Whites are the dominate racial group across the City. However, since 2010 Yreka has become more ethnically and racial diverse with the number of Whites Alone decreasing by six percentage points. During the same time period the number and percentage points of persons who are Hispanic or Latino increasing by three percentage points. The number and percentage of persons who are American Indian and Alaska Native increased by more than four percentage points. The number and percentage of persons who are Asian Alone increased during the same period, as shown in Table B-1 below.
Table B-1 Race and Ethnicity, 2010 and 2020
| City of Yreka | City of Yreka | City of Yreka | City of Yreka | Siskiyou County | Siskiyou County | Siskiyou County | Siskiyou County | |
|---|---|---|---|---|---|---|---|---|
| 2010 | % | 2020 | % | 2010 | % | 2020 | % | |
| Total | 7,765 | 100% | 7,807 | 44,900 | 100% | 44,207 | ||
| Hispanic or Latino | 753 | 9.7 | 958 | 12.3 | 4,615 | 10.3 | 5,527 | 12.5 |
| Not Hispanic or Latino | 7,012 | 90.3 | 6,849 | 87.7 | 40,285 | 89.7 | 38,549 | 87.2 |
| Population of One Race: | 6,649 | 85.6 | 6,192 | 79.3 | 38,445 | 85.6 | 35,454 | 80.2 |
| White Alone | 6,078 | 78.3 | 5,314 | 85.8 | 35,683 | 79.5 | 32,057 | 90.4 |
| Black or African American | 53 | 0.7 | 66 | 1.1 | 552 | 1.2 | 471 | 1.3 |
| American Indian and Alaska Native | 413 | 5.3 | 616 | 9.9 | 1,549 | 3.4 | 1,757 | 5 |
| Asian Alone | 90 | 1.2 | 147 | 2.4 | 528 | 1.2 | 866 | 2.4 |
| Native Hawaiian and Other Pacific Islander | 8 | 0.1 | 10 | 0.2 | 69 | 0.2 | 38 | 0.1 |
| Some Other Race | 7 | 0.1 | 39 | 0.6 | 64 | 0.1 | 265 | 0.8 |
| Population of Two Races | 321 | 4.1 | 612 | 8.4 | 1,840 | 4.1 | 2,894 | 6.6 |
| White; Black or African American | 26 | 8.1 | 47 | 7.7 | 153 | 8.9 | 262 | 9.1 |
| White; American Indian and Alaska Native | 225 | 70.1 | 402 | 65.7 | 1,196 | 69.8 | 1,708 | 59 |
| White; Asian | 40 | 12.5 | 58 | 9.5 | 186 | 10.9 | 277 | 9.6 |
| White; Some Other Race | 5 | 1.6 | 77 | 2.3 | 50 | 2.9 | 466 | 16.1 |
| White; Native Hawaiian and Other Pacific Islander | 3 | 0.9 | 14 | 12.6 | 22 | 1.3 | 79 | 2.7 |
| All Other | 22 | 6.9 | 14 | 2.3 | 107 | 6.2 | 102 | 3.5 |
| Population of Three or More Races | 42 | 0.5 | 45 | 0.6 | 126 | 0.3 | 201 | 0.5 |
Source: 2010 and 2020 US Census, Table P2
Figure 3 shows that geographically more diverse areas are at the City’s western, eastern, and southern edges, as indicated by higher population percentages of Non-Whites residing in these geographic areas shown with gradations of brown shading. As shown in Figure 1, Diversity Index 2018 Block Group, the population residing east of State Highway 263 is more diverse with Diversity Index score of 58 whereas areas west of State Highway 263, are less diverse with Diversity Index scores of 44 (indicated with the light green shading) and 36 (yellow).20 The pattern of the City’s diversity index scores largely extend to the unincorporated areas adjacent to the City limits. The diversity scores of the unincorporated areas generally decrease as the distance from the City limits increase, indicating the City is more diverse. Where diversity decreases, residents tend to be White, nonHispanic. The 2020 geographic diversity pattern is similar to the pattern in 2010 with the area east of State Highway 263 being more diverse. The map of Neighborhood Segregation (Figure 2) shows geographic areas where groups have more than 10 percent representation within a given Census tract. For Yreka the data indicates the ‘3 Group Mixed’ has the largest geographic distribution in Yreka: most of the area east of State Highway 263 and Fairchild Medical Center neighborhoods. The Downtown area is ‘Other-White’, and the western edges of the City and neighborhood south Greenhorn Road and south of the convergence of State Highway 3 and Interstate 5 are ‘Mostly White’. The patterns of neighborhood segregation occurring in the City continue outside the City limits, although further away from the City the population is increasing White, non-Hispanic. This pattern is consistent with Table A-5 which shows 90.4 percent of residents of the County are White to the City’s 85.8 percent. The City’s greater diversity relative to the unincorporated area is consistent with the racial and ethnic composition data presented in Table A-5 in Appendix A. The data for ethnic distribution (Figure 3) presents a scattered distribution pattern, with areas where 20 percent or less are non-white being adjacent to areas where 61 percent or more of residents are Non-White.
To summarize, areas where there is an increased concentration of non-White residents, i.e., greater than 60 percent, as indicated in Figure 3, include the Karuk Tribal lands, and the following neighborhoods: Fairchild Medical Center, portions of Greenhorn Park, North Foothill Drive, small pockets in Downtown adjacent to State Route 263, and Oberlin-Center. The available data suggests concentrations of non-Whites relate to:
- Yreka is more ethnically and racially diverse in 2020 than in 2010 according to Census data.
- Karuk Tribal housing is only available to tribal members in accordance with funding programs rules.
- As reviewed below, some of the geographic areas discussed above are more diverse, the data indicates there are concentrations for disability, lower incomes and greater rates of poverty, and more single parent households.
Regional Comparison
Section titled “Regional Comparison”As shown in Table B-1 and Image 1, Whites are the predominate ethnic group in most of Siskiyou county. In the northeastern corner Hispanics are the dominant group. For both Yreka and the county there are more Hispanics in 2020 than in 2010. Agriculture is a dominant industry in the northeastern corner and with a larger population of farmworkers. As indicated in Table B-1, American Indians and Alaska Natives are 2 nd largest racial group in both the county and Yreka. In Yreka American Indians and Alaska Natives are a greater percentage of the population, comprising 9.9 percent of the population in comparison to 5 percent in the county.
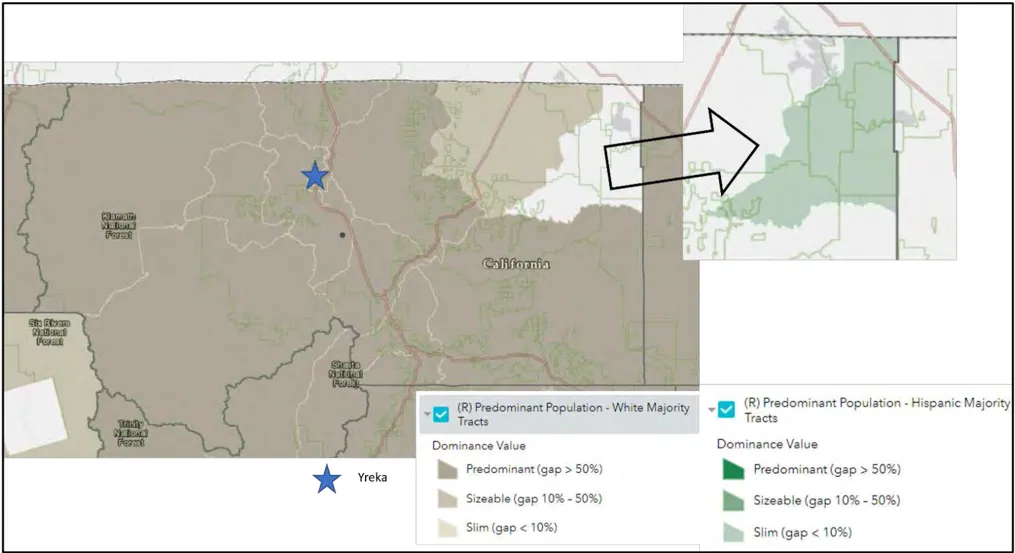
As discussed above, Yreka is more diverse (as indicated by the 2018 Diversity Index value) than the areas just outside the city limits. Image 2 indicates that Yreka is similarly diverse to noncontiguous areas in the County, although the block group in the northeast corner has a higher diversity index.
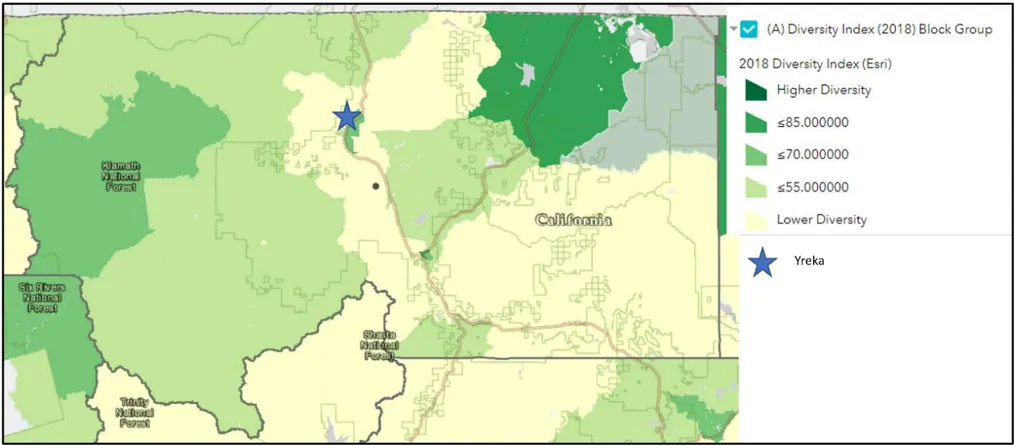
3.1.2. PERSONS WITH DISABILITIES
Section titled “3.1.2. PERSONS WITH DISABILITIES”Persons with disabilities are more likely to reside east of Highway 263 and in the neighborhoods surrounding the Fairchild Medical Center. In these geographic areas more than 22 percent of the population have a disability, as shown in Figure 4. Approximately 17 percent of residents in the downtown area have a disability. The geographic areas having the lowest percentage of persons with disabilities are west of Downtown, the Greenhorn Road, and portions of the Campbell Tract neighborhoods. Table A-17 in Appendix A shows 46 percent of persons who are 65 and older have a disability in Yreka. The three most common types of disability for this age group are hearingvision, ambulatory, and self-care difficulties.
Concentrations of persons with disabilities in the above geographic areas relate, in part, to the North Foothill Drive neighborhood having two assisted housing developments that are age restricted to seniors. The fact these are relatively large and new multifamily developments that received state and/or federal funds, these projects would have been mandated to provide a minimum number of accessible units. This may contribute to the concentration of persons with disabilities. Like the age restrict developments in the North Foothill neighborhood, the Oakridge mobilehome park retirement community, with a concentration of seniors, which contribute to a concentration of persons with disabilities for some of the Fairchild Medical Center neighborhood. Tribal members tend to have poorer health outcomes relative to the rest of the population which may cause disabilities, and the geographic concentration of the Karuk Tribal lands reflect, in part, these outcomes.
Regional Comparison
Section titled “Regional Comparison”For purposes of comparison the City consulted the draft Siskiyou County Housing Element, dated October 19, 2022, as the draft Housing Element analyzed 2015-2019 ACS data, which is more recent than the data available on the AFFH data viewer. According to the County’s draft 6th cycle Housing Element (pg. 80), County staff found:
In the Northwestern Region and Southwestern Region, 20-30% of the population has a disability. In the Northeastern Region, 10-20% of the population has a disability. In the Northern Region, 20-30% of the population has a disability with the exception of the areas surrounding Yreka (Census Tracts 7.01 and 7.02), where 10-20% of the population has a disability. In the Southeastern Region, 10-20% of the population has a disability with the exception of Census Tract 12, where 20-30% of the population has a disability.
Table B-2 Yreka and Siskiyou County Population by Age, 2019
| Age | Yreka 2019 | Yreka 2019 | Siskiyou County 2019* | Siskiyou County 2019* |
|---|---|---|---|---|
| Age | Persons | Percentage | Persons | Percentage |
| <5 | 608 | 8.0% | 2,327 | 5.4% |
| 5-14 | 1,111 | 14.7% | 5,023 | 11.6% |
| 15-24 | 726 | 9.6% | 4,436 | 10.2% |
| 25-34 | 1,217 | 16.1% | 4,437 | 10.2% |
| 35-44 | 945 | 12.5% | 4,339 | 10.0% |
| 45-54 | 597 | 7.9% | 4,866 | 11.2% |
| 55-64 | 844 | 11.2% | 7,308 | 16.8% |
| 65+ | 1,514 | 20.0% | 10,732 | 24.7% |
| Total | 7,562 | 100% | 43,468 | 100.0% |
- Values include all cities and the unincorporated areas of Siskiyou county.
Source: Table DP05 2015-2019 ACS are estimates
More than 22 percent of Yreka residents who reside east of Interstate 5 and in the Fairchild Medical Center neighborhood have a disability. These two areas have the highest percentage of individuals who have a disability. Seventeen to 20 percent of residents in the Downtown neighborhood have a disability, with the Greenhorn Park and Campbell Tract neighborhoods having the lowest percentage. The percentage of the population who have a disability and who reside east of Interstate 5, in the Fairchild Medical Center and Downtown neighborhoods is similar to the northwestern region and southwestern regions of the County. Like Yreka, individuals who are 65 and older are the largest age group in the county also, as shown in Table B-2. As show in Table B-3, for the regional nearly 48 percent of individuals who are 65 and older have a disability according to 2019 ACS data. This rate is greater than Yreka’s. (Note: similar data is reported in Appendix A, Tables A-17 and A-18, however, the time period of the data contained in Appendix A is 2016-2020, whereas the data time period of Table B-3’s data is 2015-2019.)
Table B-3 Total Disabilities for Ages 65 and Older
| Siskiyou county | Siskiyou county | Yreka | Yreka |
|---|---|---|---|
| Number | Percent | Number | Percent |
| 3,850 | 47.7% | 596 | 41.6% |
Source: 2015-2019 ACS S1810
3.1.3. INCOME AND POVERTY
Section titled “3.1.3. INCOME AND POVERTY”The City also assessed incomes measures as household income is a critical variable affecting the ability of households to access housing. Figure 4B presents median income by Census block groups. Figure 4B shows the geographic extent of households having a median income between $30,000 to less than $50,000 to be the largest: residents living east of State Highway 263 (except for the Campbell Tract neighborhood), the Fairchild Medical Center Neighborhood, and neighborhoods in the southeastern portion of Downtown. The household income for all other geographic areas is between $55,000 and $87,100. When Figure 4B’s data is compared to concentrations of poverty (Figure 5), similar patterns are observed: Figure 5 shows a greater percentage of Yreka residents, 20 to 30 percent, fall below the poverty line reside east of State Highway 263 and in Fairchild Medical Center neighborhoods.21 While a lower percentage of residents live at or below poverty line, 10 to 20 percent, reside in the neighborhoods in Yreka’s Downtown, this is another geographic concentration. In the Greenhorn Road Neighborhood west of State Highway 3, and at the City’s western edge, less than 10 percent of residents fall below the poverty line in these neighborhoods. Much of Yreka is considered a low-income community because the median income is 80 percent or less of the statewide median income. Table A-10 reports a significant difference in the median incomes of owners and renters: $53,611 and $29,662 both of which are less than 80 percent of the statewide median income of $78,672 as of 2022. This data is consistent with Table A-9 ‘Households by Income Group, 2019’, which indicates nearly 38 percent of Yreka residents are low income with an annual income that does not exceed $33,987, 20 percent of residents are moderate income and 43 percent are above moderate income. There are no areas within Yreka’s city limits that have a poverty rate above 30 percent as show in Figure 5. Table B-4 below shows that 24.5 percent of Yreka households are below the poverty guideline (as of 2019). For Yreka female-headed households, 7.3 percent were below the poverty guidelines. (The 2019 poverty guideline was $25,750 for a household of four, and $16,910 for a household of two (https://aspe.hhs.gov/topics/poverty-economic-mobility/poverty-guidelines/prior-hhs-poverty-guidelinesfederal-register-references/2019-poverty-guidelines, accessed January 11, 2023).)
Table B-4 Poverty Rates for Yreka and Siskiyou County Households
| Yreka | Yreka | Siskiyou* | Siskiyou* | |
|---|---|---|---|---|
| Total Householders | 1,684 | 100% | 11,396 | 100% |
| Female-Headed Householders Under the Poverty Level | 123 | 7.3% | 602 | 5.3% |
| Total families Under the Poverty Level | 413 | 24.5% | 2029 | 17.8% |
- Values include all cities and the unincorporated areas of Siskiyou county.
Source: ACS 2015-2019, Table B17012
The data shows similar concentration patterns for income as discussed above for other AFFH variables. The 146 Karuk Tribal Housing Authority housing units are income qualified. North Foothill has four income restricted multifamily developments, and units are available only to income-qualified tenants. These four developments all together have a total of 224 housing units. Some of the existing land uses found in the Fairchild Medical Center may suggest why the median incomes in this neighborhood are lower: mobilehome parks, such as Oakridge, provide housing that is typically of lower cost and may be a more affordable housing option; proximity to heavy commercial uses, and the associated higher levels of noise, traffic, etc., are generally considered less desirable. The cost of housing units (purchase price and rent) may be less due to proximity to these less desirable land uses relative to other neighborhoods in the City. Similar to the Fairchild Medical Center neighborhood, median incomes in the Southeast and Oberlin-Center neighborhoods may reflect the closer proximity of heavy commercial uses resulting in housing costs that are more affordable. As stated above, the City issues more housing condemnations in neighborhoods located east of Interstate 5. This information indicates housing may be more affordable to households with lower incomes due to condition issues. Also, this information suggests homeowners in neighborhoods east of Interstate 5 may be on fixed incomes and the ability to afford repairs and maintenance may be more financially difficult.
As shown in Figure 4B there are no block groups in Yreka that are above HCD’s 2020 State median income of $87,100. As discussed in section 3.2.2 in Appendix A, the median income of Yreka is less than 80 percent of the State median income: approximately 58 percent of the city’s households have incomes at or below the lowincome limit. The remaining 43 percent of households have incomes above the low-income limit (8 percent of households earn incomes that fall into the moderate-income category; 35 percent of households fall into the above moderate-income category).
Regional Comparison
Section titled “Regional Comparison”Figure 4.B of Appendix B displays ACS median income data (2015-2019) for Yreka. Image 3 below displays the same data but zoomed out to include the entire county for comparison purposes. As shown in Table B-4, a greater percentage of Yreka households are below the federal poverty guidelines in comparison to the Siskiyou county.
Median Income
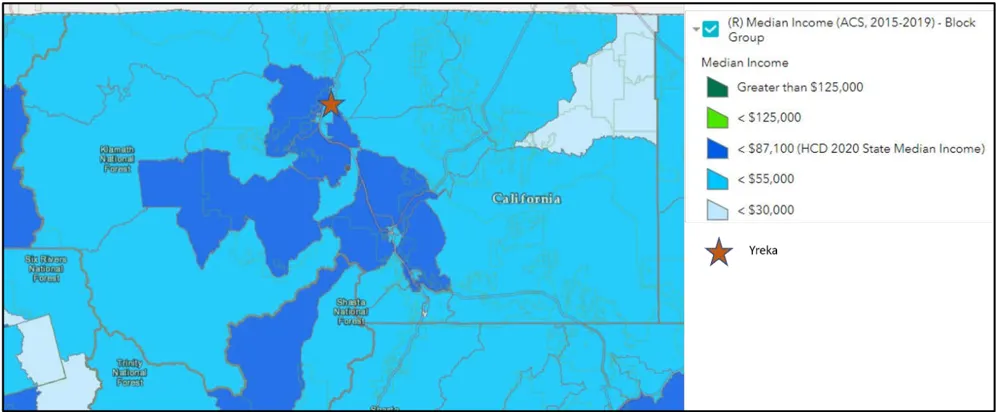
The median household income in Yreka is similar with the median household income and patterns of the adjacent areas and the larger Siskiyou county region. Household median income of the block group residing in the northeast corner of the county is the lowest at less than $30,000. There are no block groups in the Siskiyou county that are above HCD’s 2020 State median income of $87,100, and the median income of the region is less than 80 percent of the State median income.
Image 4 depicts the percentage of households whose income was below the poverty level for the region. There are two northern tracts with similar poverty levels as Yreka neighborhoods that are east of Interstate 5, and the Fairchild Medical Center neighborhood. The Siskiyou county western and eastern tracts see higher rates of poverty. Only the tract that nearly surrounds Yreka has poverty levels of less than 10 percent, which comports with the higher median income data that is seen for this same area in Image 3. The data for the corresponds to
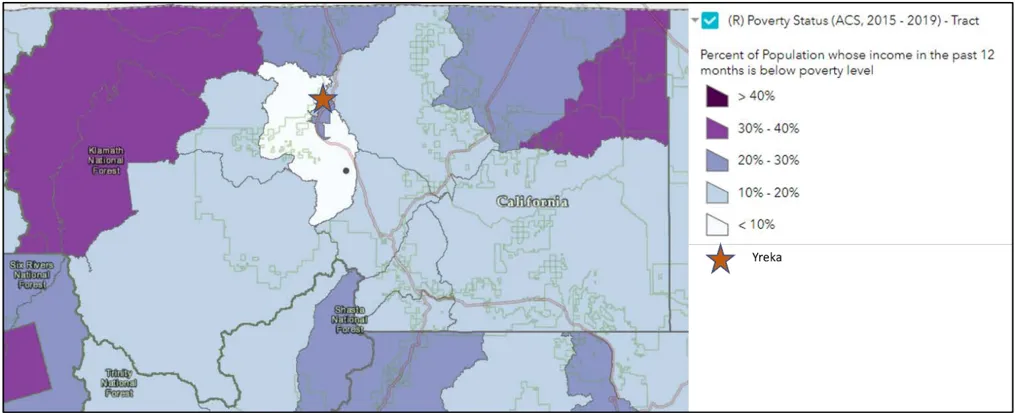
3.1.4. FAMILIAL STATUS
Section titled “3.1.4. FAMILIAL STATUS”As presented in Table A-6, Appendix A, families comprised a majority of households in Yreka in 2020, although the total number of family households declined from 2010. In 2020, a greater percentage of married-couple family households had children: 25 percent in 2010 and 27 percent in 2020. With respect to geographic distribution, married-couple households with children are most likely to reside west of State Highway 263, except for the Fairchild Medical Center neighborhoods and the portion of the Greenhorn Park neighborhood that southerly of the convergence of State Highway 3 and Interstate 5 as shown in Figure 6. As discussed in Appendix A, the total number single-parent households were nearly identical in 2010 and 2020 but the number and percentage of female householders, no spouse, and female householders, no spouse, with children relative to all family households declined from 2010 to 2020. Over 30 percent of children who live in female headed households, no spouse, are geographically concentrated in the area east of State Highway 263 (except for the Campbell Tract neighborhood where less than 10 percent of children live in female headed households, no spouse), as illustrated in Figure 7. In the southeast Downtown neighborhoods, 20 to 30 percent of children reside in female headed households, no spouse. In the neighborhoods around Fairchild Medical Center, 10 to 20 percent of children reside in female headed households, no spouse.
Single parent households, particularly female-headed households, generally have lower-incomes and higher living expenses, often making the search for affordable, decent, and safe housing more difficult. In addition to difficulties faced by these households in finding and maintaining affordable housing, these households also typically have additional special needs relating to access to childcare, health care and other supportive services. As presented in Appendix A, section 3.1, including Table A-6, from 2010 to 2020, Yreka saw decline in the female household, no spouse, with children, in both number and as a percentage. Male households, no spouse, with children, however, increased significantly during the same period. The relevant sections of Table A-6 are excerpted below in Table B-5.
Table B-5 Yreka Single Parent Households with Children, 2010 and 2020
| HouseholdType | 2010 | 2010 | 2020 | 2020 | %ChangeFrom 2010 to 2020 |
|---|---|---|---|---|---|
| Number | Percentage | Number | Percentage | ||
| FemaleHouseholder,no spouse, with Children | 378 | 64 | 260 | 71.2 | (31.2) |
| MaleHouseholder,no spouse, with Children | 32 | 32.7 | 149 | 73.4 | 366 |
Excerpt of Table A-6, Appendix A. Negative values are shown in parathesis.
Sources: American Community Survey, 2010 and 2020, Table S1101 and Table B26001.
At this time, a geographic distribution of male headed households with children and no spouse is not available. Given the perverseness of Yreka’s low median income throughout the City this analysis assumes the geographic distribution of male householders, no spouse, and with children aligns with the geographic distribution pattern of female headed households with children and no spouse. The highest rates of female headed households with children and no spouse occur east of Interstate 5. The concentration of female-headed households east of Interstate 5 is associated, in part, to the number of housing units that are assured to be affordable to incomequalified households. In the case of single parent households who are Karuk tribal members, the available of affordable housing units that are suitable for families would contribute the concentration of female headed households with children in this area.
Regional Comparison
Section titled “Regional Comparison”The percentage and patterns of female headed households in Yreka, Figure 7, are similar those at the regional level, as indicated in Image 5. For the geographic southwestern, middle, and eastern subregions of Siskiyou county, there are low percentage of children residing in female headed households with no spouse or patterner present. We see a similar pattern, generally, for children residing on west of Interstate 5. Twenty to 40 percent of children who reside in the other subregions of Siskiyou county are in female headed households with no spouse or patterner present. The geographic patterns where a higher percentage of children live in female headed households without a spouse or partner present are similar to those of poverty status seen in Image 4 above, except for the northeast corner of the county.
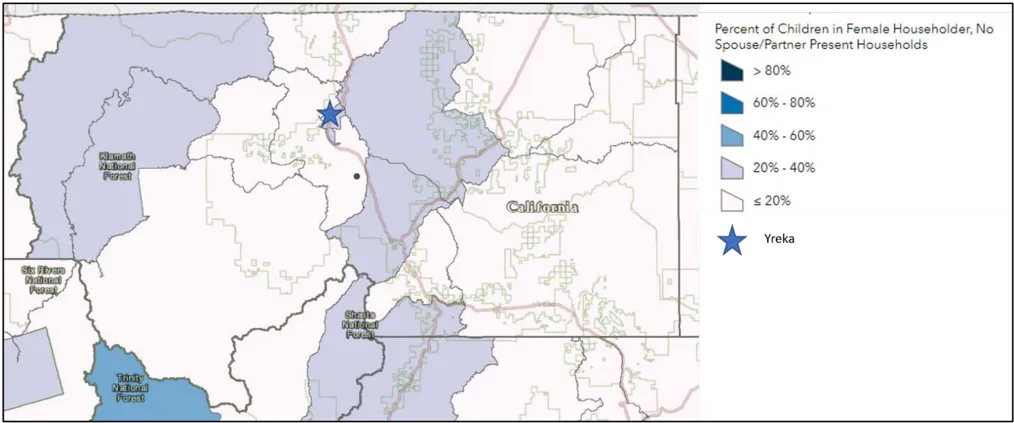
3.1.5. PROXIMITY TO JOBS
Section titled “3.1.5. PROXIMITY TO JOBS”Generally, many Yreka residents live relatively close to jobs according to Figure 8. Residents of Downtown neighborhoods have the furthest proximity to jobs, meaning these residents have the longest (as measured by distance) commute to reach jobs. This data indicates the northwestern portion of the City has the lowest number of job centers relative to the rest of the City. Overall, Yreka residents have relatively low commute times with 88 percent of Yreka residents commuting less than 30 minutes to their job, as indicated in Table A-10 in Appendix A.
Regional Comparison
Section titled “Regional Comparison”Relative to the region, residents in Yreka generally, reside in close proximity to jobs and employment, as shown by the blue and green polygons in Image 6. This data is positive for residents of Yreka. It may be an opportunity to attract economic and housing development to Yreka.
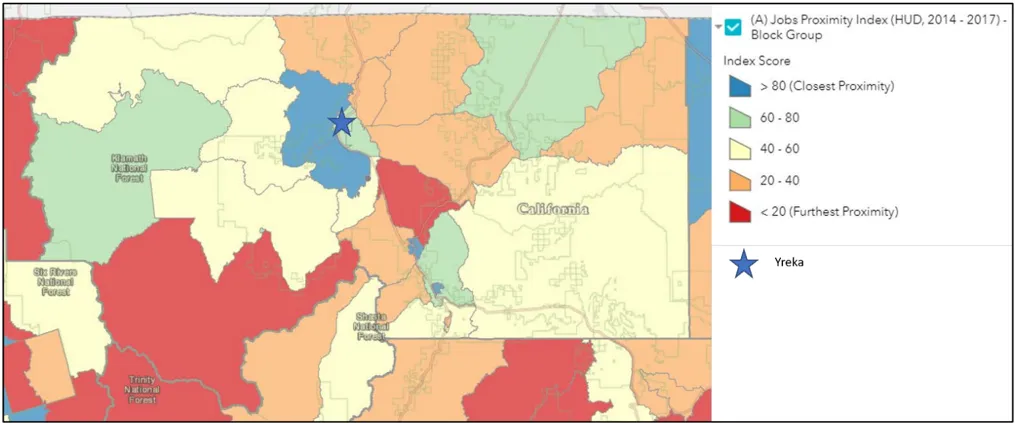
3.2. ACCESS TO OPPORTUNITY
Section titled “3.2. ACCESS TO OPPORTUNITY”The California Tax Credit Allocation Committee (TCAC) Opportunity Areas mapping is an approach ‘to measure and visualize place-based characteristics linked to critical life outcomes, such as educational attainment, earnings from employment and economic mobility’ (Methodology for the 2021 TCAC/HCD Opportunity Map, pg. 1). The indicators indexed include high levels of employment and close proximity to jobs, access to effective educational opportunities for both children and adults, low concentration of poverty, and low levels of environmental pollutants, among others. Moderate resource areas have access to many of the same resources as high and highest resource areas but may have longer commutes to places of employment, lower median home values, fewer educational opportunities, or other factors that lower their indices for economic, environmental, and educational indicators. Areas of high segregation and poverty are those that have an overrepresentation of people of color compared to the County, and at least 30 percent of the population in these areas is below the federal poverty line ($26,200 annually for a family of four in 2020). Geographic areas with higher resource scores indicate areas that support positive economic, educational, and health outcomes for low-income families. HCD recommends jurisdictions consult these maps as part of their AFFH analysis to help identify opportunity areas to locate and prioritize affordable housing. The maps are used by TCAC to evaluate and rank funding applications for housing.
3.2.1. ECONOMIC DOMAIN
Section titled “3.2.1. ECONOMIC DOMAIN”The TCAC economic domain metric considers poverty, education attainment of the adult population, proximity to jobs job and median home value indicator. For Yreka, the most positive economic outcomes are likely for populations residing on the western side of the side as shown in green in Figure 9 and in the Campbell Tract neighborhood.
The economic outcome value assessed for the Karuk Tribal Lands and in the North Foothill Drive neighborhood appears to reflect, at least in part, the presence of over 200 assisted housing units. The Greenhorn Park neighborhood assessment as having “more positive economic outcomes’ is likely attributed to the numerous commercial and visitor serving businesses in this neighborhood making it a local job center. Also, at the southerly city limit there is a neighborhood of detached single family residences that are separated by distance from the commercial and visitor serving uses. This distance may improve the home values of the housing units. The areas of the Downtown neighborhood assessed to have more positive economic outcomes reflects relative higher median incomes and lower rates of poverty. Residents in this area are more likely to have higher educational attainment. These socioeconomic attributes all together likely manifest as higher property values. The Fairchild Medical Center and the neighborhood is not fully developed. There may be opportunities for mixed use development with housing, including employee housing, that complements medical uses.
3.2.2. EDUCATION DOMAIN
Section titled “3.2.2. EDUCATION DOMAIN”For the education domain, the TCAC factors math and reading proficiency, high school graduation rates, and student poverty. The 2020 assessment of Greenhorn Park sub-neighborhood as having a less positive education outcome (0.25-0.50 in comparison to 0.50-0.75 for much of the city) seems inaccurate and may reflect the numerous commercial and visitor serving uses in this area. The newer TCAC data indicates the likelihood of positive outcomes in the education domain across the City decreased from 2020 to 2021. This decline may reflect the challenges of virtual-teaching for both educators, students, and families during the COVID-19 pandemic, and declines have been near-universal. As of the beginning of the 2022-2023 academic year all Yreka public schools have returned to in person instruction. Yreka public schools are located in the Downtown and Fairchild Medical Center neighborhoods. Students who reside beyond walking distance, the school districts offer bus service, which extends to the North Foothill Drive neighborhood and Karuk Tribal Lands. As discussed above, all of the schools participate in state and federal school lunch programs.
Improving opportunities to develop a variety of housing types, including housing that is affordable, in proximity to schools will support education opportunities. Because the schools are located in neighborhoods that are established and generally development is denser, City housing policies that encourage ADUs, SB 9 housing, infill development, and adaptive reuse will enable more housing and different types to be developed near existing schools.
3.2.3. ENVIRONMENTAL DOMAIN
Section titled “3.2.3. ENVIRONMENTAL DOMAIN”This domain relies on twelve of the indicators that are used in the California Office of Environmental Health Hazard Assessment (OEHHA)’s CalEnviroScreen 3.0 tool which are subcomponents of the ‘pollution burden’. The twelve indicators are grouped into two categories, ‘exposure’ and ‘environmental effects’:
| Exposure indicators: | Environmental effects indicators: |
|---|---|
| 1. Ozone Concentrations | 8. Cleanup Sites |
| 2. PM2.5 Concentrations | 9. Groundwater Threats |
| 3. Diesel PMEmissions | 10. Hazardous Waste Generators and Facilities |
| 4. Drinking Water Contaminants | 11. Impaired Water Bodies |
| 5. Pesticide Use | 12. Solid Waste Sites and Facilities |
| 6. Toxic Releases from Facilities | |
| 7. Traffic Density |
The ranking of outcomes in the environmental domain are illustrated in Figure 11. Yreka’s Downtown neighborhoods are ranked as having the most positive environmental outcomes. Most neighborhoods lying east of State Highway 263 and in and around Fairchild Medical Center ranked below the Downtown neighborhoods. Neighborhoods in the western edges of the City, south of the convergence of State Highway 3 and Interstate 5 and south Greenhorn Road were ranked to have the least positive outcomes. Lower environmental scores reflect historic and current heavy commercial and industrial uses.
3.2.4. TRANSPORTATION AND PUBLIC TRANSIT
Section titled “3.2.4. TRANSPORTATION AND PUBLIC TRANSIT”Yreka and Regional Comparison
Section titled “Yreka and Regional Comparison”HUD developed the transportation cost index that ‘estimates of transportation expenses for a family that meets the following description: a 3-person single-parent family with income at 50% of the median income for renters for the region’ at the Census tract level (HCD AFFH Data Resources and Mapping Tool, accessed January 11, 2023). The lower the index score, the higher the transportation costs. Index scores are affected by the availability of public transit, the density of housing, services, and jobs in a community. The entirety of Yreka and Siskiyou county have the lowest transportation index score of 0-20 (where 79-99 is the highest score). For a large rural county, and Yreka being relatively low density city, and with a declining population in the region there are not many transit options beyond those provided by private vehicles and the Siskiyou Transit and General Express (STAGE).
As discussed above, the STAGE provides regional bus service that largely follows the Interstate 5 corridor with most Yreka stops located on or near Route 263. All STAGE buses are ADA compliant. STAGE offers discount annual passes for income eligible households. There are 13 STAGE stops in Yreka. The city of Yreka does not operate a separate intracity bus service. This results in little to no transit service for neighborhoods that are east of Interstate 5. At this time there are few transit opportunities for residents who reside in the neighborhoods on the east of Interstate 5. Madrone Hospice provides transportation for seniors 60 years or older. There is no rail service available in Yreka, although there is an intercity Amtrak route with a designated stop in the city of Dunsmuir, which is located approximately 46 miles south of Yreka.
3.2.5. AREAS OF OPPORTUNITY
Section titled “3.2.5. AREAS OF OPPORTUNITY”According to the 2020 TCAC Opportunity Areas (Figure 12), the Highest, High, and Moderate resource areas all occur west of State Highway 263, with almost the entirety of the area east of Highway 263 and Interstate 5 identified as Low Resource, except for the Campbell Tract neighborhood.
The TCAC mapping identifies the Highest Resource area as the northern and western portions of Yreka’s historic Downtown neighborhood that lie west of State Highway 263, as shown on Figure 12. The Highest Resource area is contiguous and extends northerly outside City limits. This Downtown sub-neighborhood is identified as a Highest Resources area due to the higher median income, more positive environmental outcomes, including better proximity to public amenities-parks, schools, etc.-and education outcomes on par with the most of Yreka. While this sub-neighborhood has infill development opportunities, its northern and western edges are within or abut a Very High Fire Severity zones, meaning housing is at greater risk from wildland fire.
There are three High Resource areas. The largest is southerly of the convergence of State Highway 3 and Interstate 5, and is a Greenhorn Park sub-neighborhood. The other High Resource areas are a neighborhood sandwiched between Lane and French streets that is west of State Highway 263. This High Resource area straddles the Fairchild Medical Center and Downtown neighborhoods. The third High Resource area is the Campbell Tract neighborhood. The educational outcome scores are more positive (with a score of 0.50 to 0.70) and are on par with the outcomes for much of Yreka including the Highest and Lowest Resource areas. The neighborhood sandwiched between Lane and French streets has opportunities for infill development. While the other two other High Resources areas, especially the Greenhorn Park sub-neighborhood, both have growth potential, these areas are also on the edge of the City making schools, services, businesses and transit less proximate.
The areas assessed to be Low Resource are most areas lying east of State Highway 263 and the Fairchild Medical Center neighborhood. As discussed earlier in this appendix, the geographic areas east of Interstate 5 consistently have lower incomes and higher rates of poverty, higher concentrations of persons with disabilities. This area, however, is more ethnically and racial diverse relative to other Yreka neighborhoods. Although it is designated as a Low Resource area, educational outcomes are more positive (with a score of 0.50 to 0.70) and are on par with the outcomes for much of Yreka. As discussed above, the Fairchild Medical Center neighborhood may have attributes that could be leveraged to attract mixed use types of development that include a variety of housing types that complement the medical facilities, such as employee housing and housing designed to meet the housing needs seniors and people with disabilities. The Fairchild Medical Center neighborhood is served by STAGE and commercial services are in the area.
While the two tracts used by the Health Places Index (HPI) includes unincorporated greater Yreka, they include a significant portion of the City. As shown on Figure 12.B, the HPI data further indicates Downtown Yreka and westward, have socio-economic attributes indicating it is an area of higher opportunity:
- 100 percent of the households have housing with complete kitchens and plumbing, whereas in the eastern tract 95.1 percent of households are residing in dwellings with complete kitchens and plumbing.
- 20 percent of the population older than 25 have bachelor’s education or higher, whereas 16.3 percent of the population have attained at least bachelor’s education.
- 91 percent of the population residing in the western tract have automobile access, compared to 84 percent of the population residing in the eastern tract. Reduced automobile affects mobility for jobs, access to basic goods and services, and overall affect access to opportunities, especially if public transit options are limited
- Nearly 99 percent of the population residing in the western tract have access to nearby parks and other open spaces; whereas nearly 61 of the population of access to nearby parks for the eastern tract.
- The reported employed percentage for the two tracts is nearly identical: 66.3 percent of the population residing in the eastern tract being employed, and 66.2 percent of those residing in the western tract being employed.22
The HPI scores depicted on Figure 12.B are a composite of the indicators discussed above and additional variables. The tract that is blue overall has healthier community conditions than 22 percent of other California tracts. The dark green tract that covers the northern part of the City has healthier community conditions than nearly 51 percent of other California tracts. The overall community health conditions are nearly 42 percent better than other tracts in California for areas that are green. The programs in Chapter 2 aim to improve access to opportunity in the higher resource areas of the City, and also improve conditions in areas that have lower resource attributes. The programs include changes to the City’s land use regulations to remove regulatory and procedural barriers to housing production and allowing more diverse types of housing by-right. Not only will the City take an active role to partner with housing developers, but it will improve the information available about ADU and SB 9 housing developments for property owners. Uniformly this information will be made available on the City’s website. The programs commit the City to applying for funding for workforce and affordable housing development but also for an owner-occupied rehab program that is oriented to property owners and correcting housing conditions.
Regional Comparison
Section titled “Regional Comparison”When comparing composite opportunity scores regionally (Image 7 and Figure 12), unlike Yreka, Siskiyou county contains contain tracts identified as areas of high segregation and poverty. These tracts are located in western and northeastern portions of the county. These areas are rural, generally are far from job centers, historically the economies of these areas have been resource dependent, the availability of local goods and services are limited along with public transportation options, and access to local healthcare options are few. Yreka’s highest resource area are the sub-neighborhoods located at the northern and western edges of the Downtown neighborhood. Siskiyou county contains tracts that are rated as high resource or highest resource, and are near Yreka.
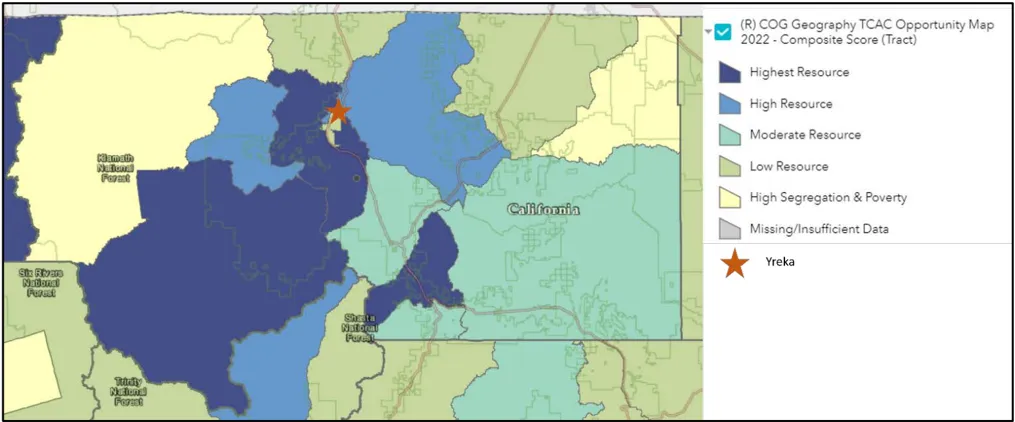
3.3. DISPROPORTIONATE HOUSING NEED AND DISPLACEMENT RISK
Section titled “3.3. DISPROPORTIONATE HOUSING NEED AND DISPLACEMENT RISK”The AFFH analysis needs to report the community’s housing problems, especially for low income households. The data indicate that many households are cost burdened, and some households are living in units that do not have adequate kitchen or plumbing. The four housing problems considered are listed below, and in Yreka, 23 percent of households are experiencing at least one of the following housing problems:
- Incomplete kitchen facilities;
- Incomplete plumbing facilities;
- More than 1 person per room (also referred to as overcrowding); and
- Cost burden greater than 30 percent.
3.3.1. HOUSING HABITABILITY
Section titled “3.3.1. HOUSING HABITABILITY”Yreka and Regional Comparison
Section titled “Yreka and Regional Comparison”Housing habitability as measured by completeness of kitchen and plumbing facilities are not reported at the city level, rather the data is reported at the broader Census tracts as part of the California Healthy Place Index (https://map.healthyplacesindex.org, accessed July 6, 2022). This tract contains a significant portion of eastern Yreka, and 95 percent of households have basic kitchen facilities and plumbing. In comparison to households in Siskiyou county and the State, the Yreka Census tract has a lower percentage of households with complete kitchens and complete plumbing. For comparison:
- Siskiyou county: 98 percent of households have basic kitchens and plumbing
- California: 98.7 percent of households have basic kitchen and plumbing.
As discussed above in Section 3.1.3, the City issues more housing condemnations in neighborhoods located east of Interstate 5, which corresponds with the geographic area depicted housing habitability of the California Health Place Index. This local information indicates housing in these areas may be more affordable to households with lower incomes due to condition issues. Also, this information suggests homeowners in neighborhoods east of Interstate 5 may be on fixed incomes and unable to afford repairs and maintenance. To address habitability issues, the Housing Element includes a program committing the City to seeking funding to develop an owneroccupied rehabilitation program that would provide low-interest loans, grants, labor, or materials to assist lowincome, older adults, or residents with disabilities make needed home repairs.
3.3.2. COST BURDEN AND OVERCROWDING
Section titled “3.3.2. COST BURDEN AND OVERCROWDING”While the median gross rent for Yreka and surrounding area is less than $1,000 a month, the American Community Survey data indicate 40 to 60 percent of renter households pay 30 percent or more of their household income to rent (see Figure 14), which nearly the entirety of the City. This indicates while Yreka rents may be low relative to other communities, renter annual median income is less than $30,000, as indicated above, and household incomes are not adequate. For the Karuk Tribal lands and the North Foothill neighborhood, the rate of cost burden may be less than depicted in Figure 14. The rate is likely to be less than mapped in Figure 14 because there are 224 income restricted housing units in these areas. These units are set aside to be affordable to lower income households, and prospective tenants are income-screened to ensure eligibility. For households residing in market rate rental units in these neighborhoods, the concentration mapping in Figure 14 is more likely to be accurate because these units would not be subject to enforceable affordability agreements. The extent of concentration suggests that renter annual median income contributes to cost burden households.
The AFFH data viewer does not have mapping available depicting overcrowding for the City of Yreka, nor does the City have firsthand knowledge of overcrowding. Overcrowding is defined by the US Census as more than 1.01 persons per room. Severe overcrowding occurs when there are more than 1.5 persons per room. Table A-32 in Appendix A indicates the number and percentage of units in the city according to occupants per room. Less than 1 percent of owner-occupied housing units and less than 2 percent of renter-occupied units were either overcrowded or severely overcrowded in 2019. Overcrowding is strongly correlated to family size, with large families more likely to experience overcrowding. According to Table A-24 in Appendix A, in 2019 approximately 4.1 percent of owner-occupied are large families with five or members, and 3.4 percent of renter households have five or members. This is a decline of 2.5 percent points over 2010. Overcrowding conditions are also more likely to occur when households are cost burdened. Cost burdened households have decreased mobility. While mapping that specifically depicts the geographic distribution of overcrowding in Yreka is not currently available, Figures 13 and 14 can be consulted as a proxies: Figure 13 shows 40 to 60 households in the Fairchild Medical Center neighborhood and almost entirely all neighborhoods that are east of Interstate 5 are renters. Figure 14 shows the same neighborhoods as depicted in Figure 13 are cost burdened. As discussed above, due to the number of assisted housing units located on Karuk Tribal lands and in the North Foothill neighborhood the rate of overpayment may be overstated.
Regional Comparison
Section titled “Regional Comparison”As seen in Image 8, the southern and eastern portions are the largest geographic area in Siskiyou county where 40 to 60 percent of renters are paying more than 30 percent of their household income to housing. There is also a northern tract where 40 to 60 percent of renters are cost burdened. These patterns are similar to Yreka’s pattern.
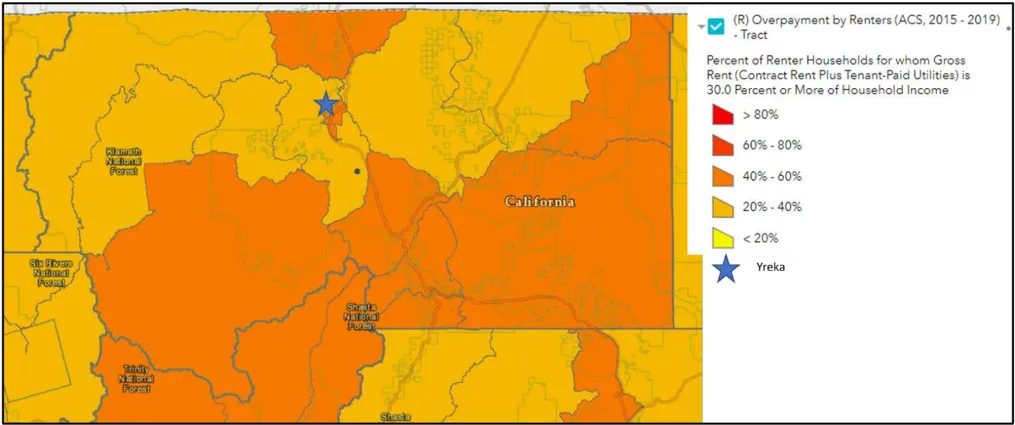
In the northeast corner of Siskiyou county, the data indicates overcrowding conditions (Image 9) are occurring. This is the same geographic area where household incomes were among the lowest at less than $30,000, 30 to 40 percent of the population income was below the poverty level, and Hispanics are a sizeable ethnic group.
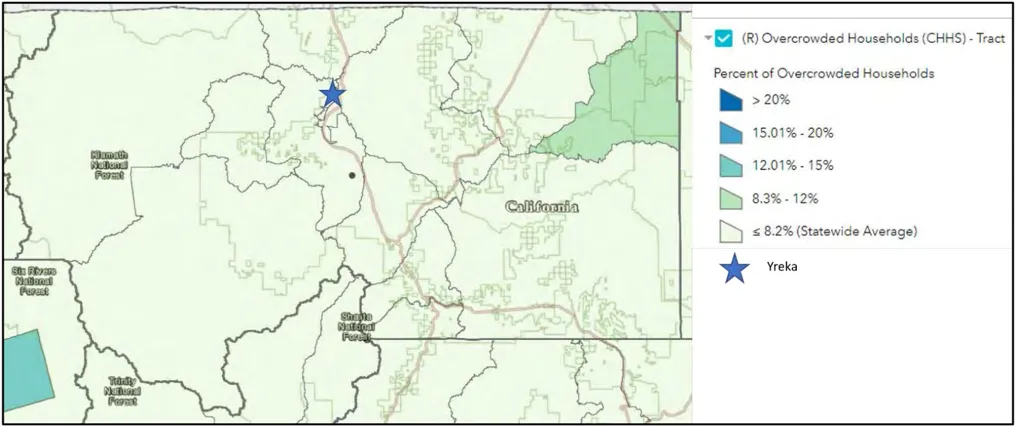
3.3.3. VULNERABLE TO DISPLACEMENT
Section titled “3.3.3. VULNERABLE TO DISPLACEMENT”Yreka and Regional Comparison
Section titled “Yreka and Regional Comparison”Figure 15 depicts the geographic area of the Yreka population who are vulnerable to displacement (thereby being designated as sensitive) due to changes housing market conditions that drastically increase the cost of housing, or displacement related to increases in redevelopment and gentrification. While some Yreka neighborhoods have become more diverse racially and ethnically since 2010, the data indicates residents in these neighborhoods tend to have lower incomes, are more likely to be renters and cost burdened, experience overcrowding, and live in housing in poor condition, as discussed above in the preceding sections.
Table B-6 Population is Considered Vulnerable to Displacement if: * Other
| Vulnerable to Displacement Criteria: | Yreka: Is the criteria met? |
|---|---|
| The share of very low income residents is above20% | Yes; 47.8 percent of households in the Figure 15 area are low income |
| And the area meets at least two of the following criteria: | |
| Share of renters is above 40 percent | Yes; 50.9% of households in the Figure 15 area are renter households. |
| Share of people of color is above 50 percent | No; share of people of color is 34 percent |
| Share of very low-income households (50 AMI or below) that are severely rent burdened households is above the county median | Yes, very low income households, less than $38,950 for a family four (2022) median income and more than 60%of renter households are severely cost burdened |
| The populations, or those in close proximity, have been experiencing displacement pressures.* | No, According to the AFFH data viewer, indicators of displacement pressures include if a geographic area is in a hot real estate market: and at this time, the area is not a hot real estate market. |
*Displacement pressure is defined as percent change in rent above county median for rent increases, or the difference between tract median rent and median rent for surrounding tracts above median for all tracts in county (rent gap).
Image 10 shows that the same population in northeastern corner of Siskiyou being vulnerable to displacement due. This is attributed to the housing needs discussed above.
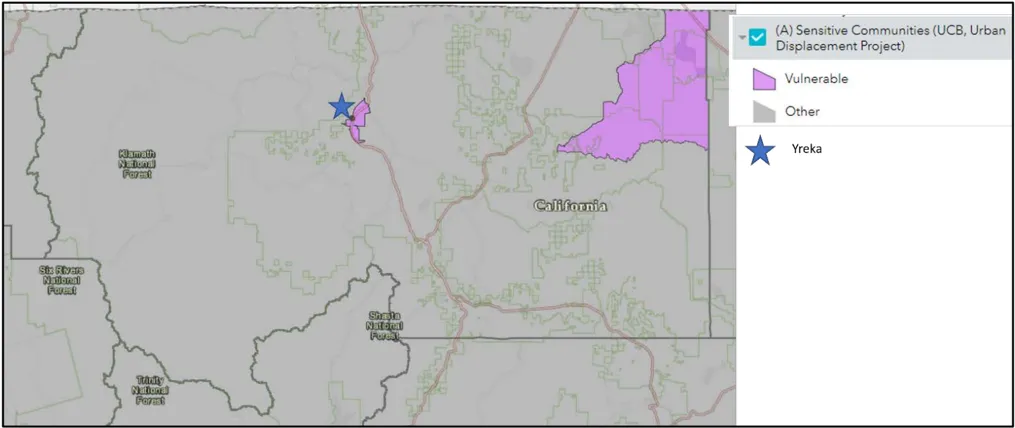
4. ENFORCEMENT AND OUTREACH CAPACITY
Section titled “4. ENFORCEMENT AND OUTREACH CAPACITY”No lawsuits or actions have resulted from discrimination complaints related to compliance with existing fair housing laws. The City implements fair housing laws by ensuring the City’s procedures, policies and regulations comply with state and federal fair housing laws, and by implementation of the code enforcement program. The City’s code enforcement is complaint driven where received complaints are investigated by a building inspector. While the City has reasonable accommodation procedures, it is undertaking a comprehensive update of the Zoning Code to modernize the Zoning Code to facilitate improvements to overall housing production, allowing a variety of housing types for all income categories, such as workforce housing, missing middle housing types and configurations, group homes, so all community members have access to affordable and sound housing.
In addition to fair housing issues related to regulations, fair housing issues can also include discriminatory behaviors by landlords such as refusal to grant reasonable accommodation requests, not allowing service animals, discrimination against familial status, sex, religion, or other protected class, and more. The City posts fair housing posters from the California Department of Fair Employment and Housing at City Hall to assist those with discrimination complaints. As complaints are received, individuals are directed to the appropriate agency. The City will continue to make information on fair housing available to the public by posting fair housing information in City Hall, the public library, other public buildings, the Senior Center and on bulletin boards at existing apartment complexes. Program HE-6-1.2 commits the City to continuing marketing fair housing information to the public including making information available on the website. The City will continue to support the enforcement of the fair housing laws to protect against housing discrimination, provide adequate information about renters’ rights, and promote equal housing opportunity.
HUD’s Region IX Office of Fair Housing and Equal Opportunity (FHEO) fair housing data set indicates two cases were filed from 2006 to June 2020 for all of Siskiyou county during the 14 year reporting period. This is a case rate of 0.05 cases per one thousand of the population. Both were disability bias cases. According to the California Department of Fair Employment and Housing 2020 annual report, there was one housing violation for the Siskiyou county region (the type of violation, e.g., disability, race, etc. is not indicated). Available data regarding inquiries to the office of Fair housing and Equal Opportunity from residents about possible discrimination indicates Yreka’s inquiry rate was less than 0.25 per one-thousand people for the period of January 2013 to March 2021. A resident may not further pursue an inquiry for a variety of reasons. While underreporting may occur, the available data indicates a low incident rate of housing discrimination in the City. In addition to continuing to make fair housing information available, Program HE-6-1.2 commits the City to codifying its reasonable accommodation procedures into the Zoning Code, and marketing the availability of the procedures to the public. This Program includes a review of the current procedures for compliance with federal and state fair housing law, and preparing amendments as needed.
5. CONTRIBUTING FACTORS
Section titled “5. CONTRIBUTING FACTORS”Discussions with community organizations, fair housing advocates, and the assessment of fair housing issues identified the following factors that contribute to fair housing issues in Yreka. See Chapter 2, Program 3.1.1 and Table 2-2, for Yreka’s AFFH Action Plan. Table 2.2 details the City’s specific AFFH action to address the fair issues and contributed factors identified below. Table 2-2 includes details regarding the geographic targets, deliverable(s), metrics for determining success, and milestones and timelines for each AFFH action.
| Priority (high, medium, low) | Fair Housing Issue | Contributing Factors | City AFFH Action (see Chapter 2, Program 3.1.1 for details) |
|---|---|---|---|
| High | There are shortages of: • workforce housing to purchase and to rent • housing that is affordable to seniors, • housing that is accessible and affordable for persons with disabilities. Employers are losing employees or cannot attract employees because of their inability to secure safe and decent housing. | The dominance of single-family homes despite the presence of smaller households (single person), with little diversity in the types of housing. Displacement from the wildfires and loss of housing, e.g., the Slater fire. These events destroyed homes, displacing residents, and resulting in increased demand for housing in the region. Low-vacancy rates for both rental and ownership units, which reduces turnover, and limits the availability of affordable housing options; | New housing choices and affordability: See Program 3.1.1 Id #s: 2.a, 2.b, 2,c |
| Medium | The housing stock, especially units east of Interstate 5, needs repair and rehabilitation, including accessibility improvements. | High cost of new construction and rehabilitating existing residences including City fees; Housing condition of the overall inventory of housing, and the cost of repairs where needed | Housing rehab and conservation and implement Replacement Housing law See Program 3.1.1 Id #s: 4.a, 4.b |
| Medium | Households vulnerable to displacement. City-wide median income that is less than 80%of State median, and | Displacement resulting from a wide variety of conditions, for example, COVID-19 resulted in an economic depression and the loss of many incomes. Cost burdened households, especially renter households. | Funding to transform low resource areas to high resource areas, neighborhood revitalization, job |
| Priority (high, medium, low) | Fair Housing Issue | Contributing Factors | City AFFH Action (see Chapter 2, Program 3.1.1 for details) |
|---|---|---|---|
| patterns of concentration based on income, lack of access to opportunity | creation, housing mobility and r educe displacement of residents See Program 3.1.1 Id #s: 2.a, 2.b, 2,c | ||
| Medium | Fair Housing Education: Limited community awareness of fair housing protections and enforcement resources. | Lack of information made easily available to homeowners and tenants on their fair housing rights and opportunities. | Fair housing education: Develop and distribute fair housing outreach materials that informs City officials and community members of available fair housing resources and opportunities. Conduct proactive outreach to improve distribution of information and to educate community members. See Program 3.1.1, Id #s 5.a, 5.b, 5.c, 5.d, 5.e |
6. LIST OF AFFH FIGURES
Section titled “6. LIST OF AFFH FIGURES”| Figure# | Figure Title |
|---|---|
| 1A | Karuk Tribal Lands |
| 1 | Diversity Index |
| 2 | Neighborhood Segregation |
| 3 | Ethnic Population Distribution - Percent Non-White |
| 4 | Percent of Population with a Disability |
| 4B | Median Income |
| 5 | Poverty Status by Census Tract |
| 6 | Percent of Children in Married-Couple Households |
| 7 | Percent of Children in Female Headed Households |
| 8 | Jobs Proximity Index |
| 9 | TCAC Opportunity Areas - Economic |
| 10 | TCAC Opportunity areas - Education |
| 11 | TCAC Opportunity Areas - Environment |
| 12 | TCAC Opportunity Areas - Composite Score |
| 12B | Healthy Places Index |
| 13 | Renter Occupied Housing Units |
| 14 | Overpayment by Renters |
| 15 | Sensitive Communities - Displacement |
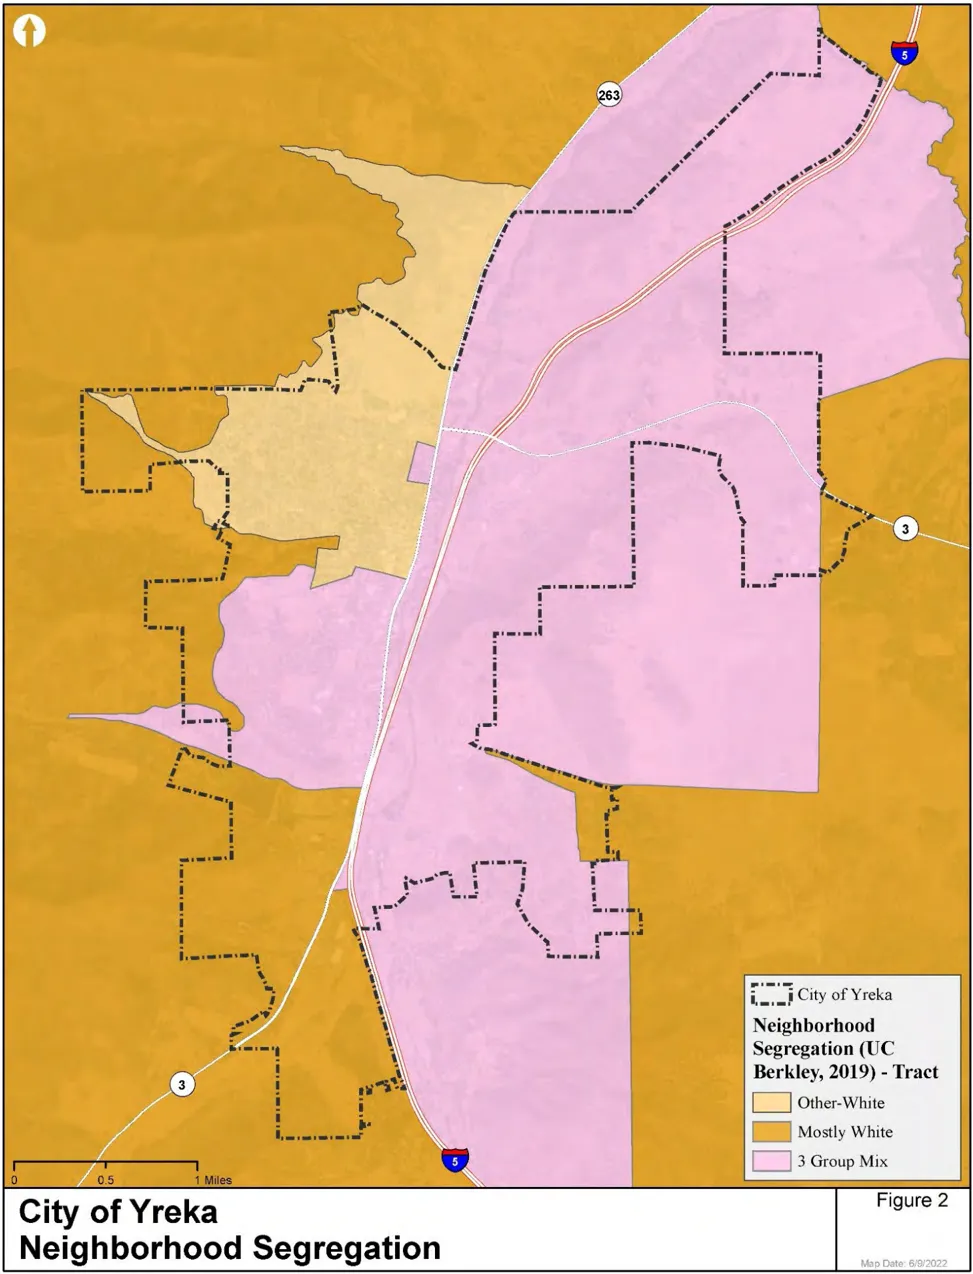
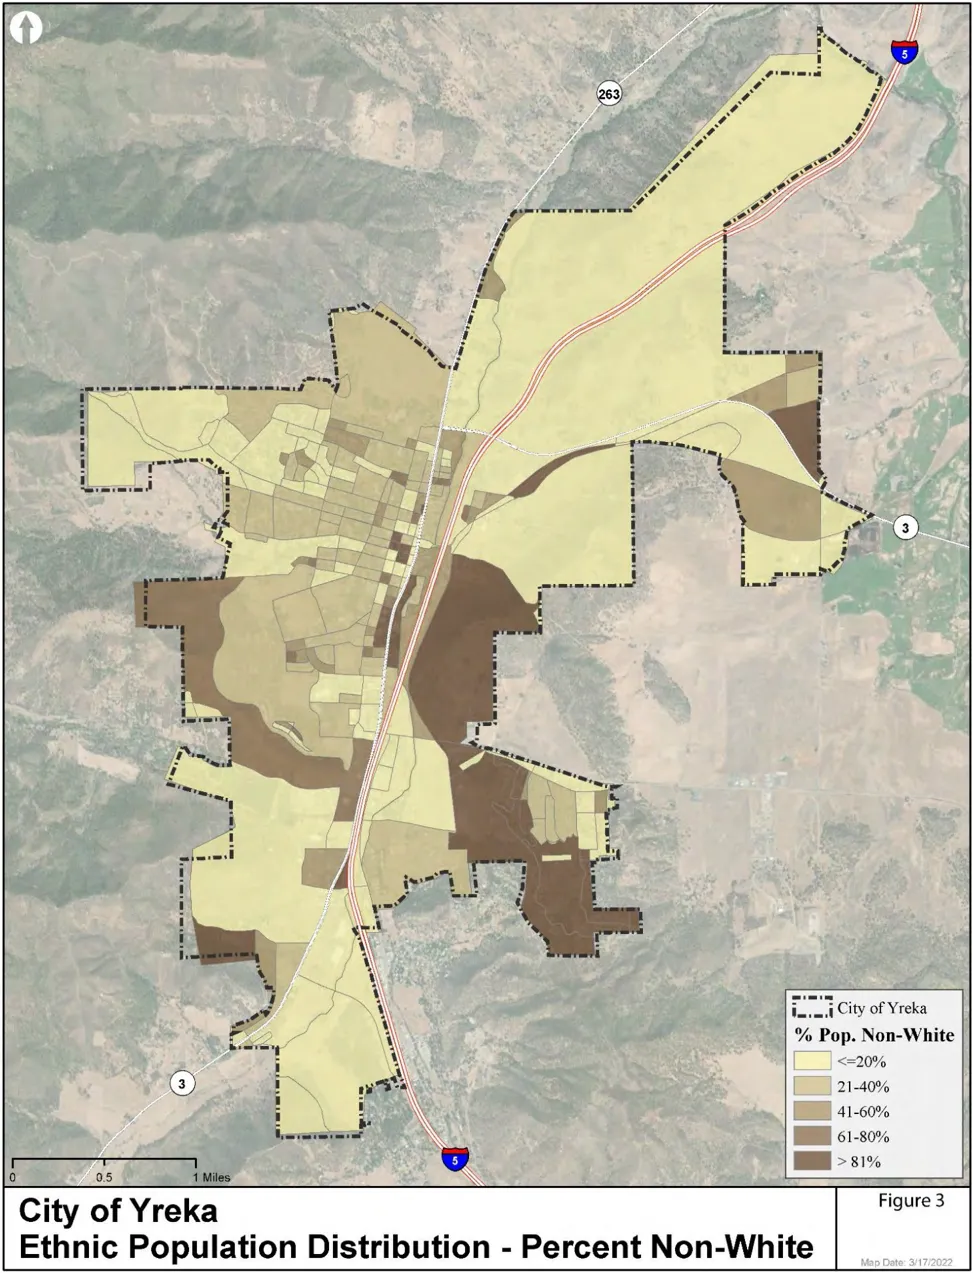
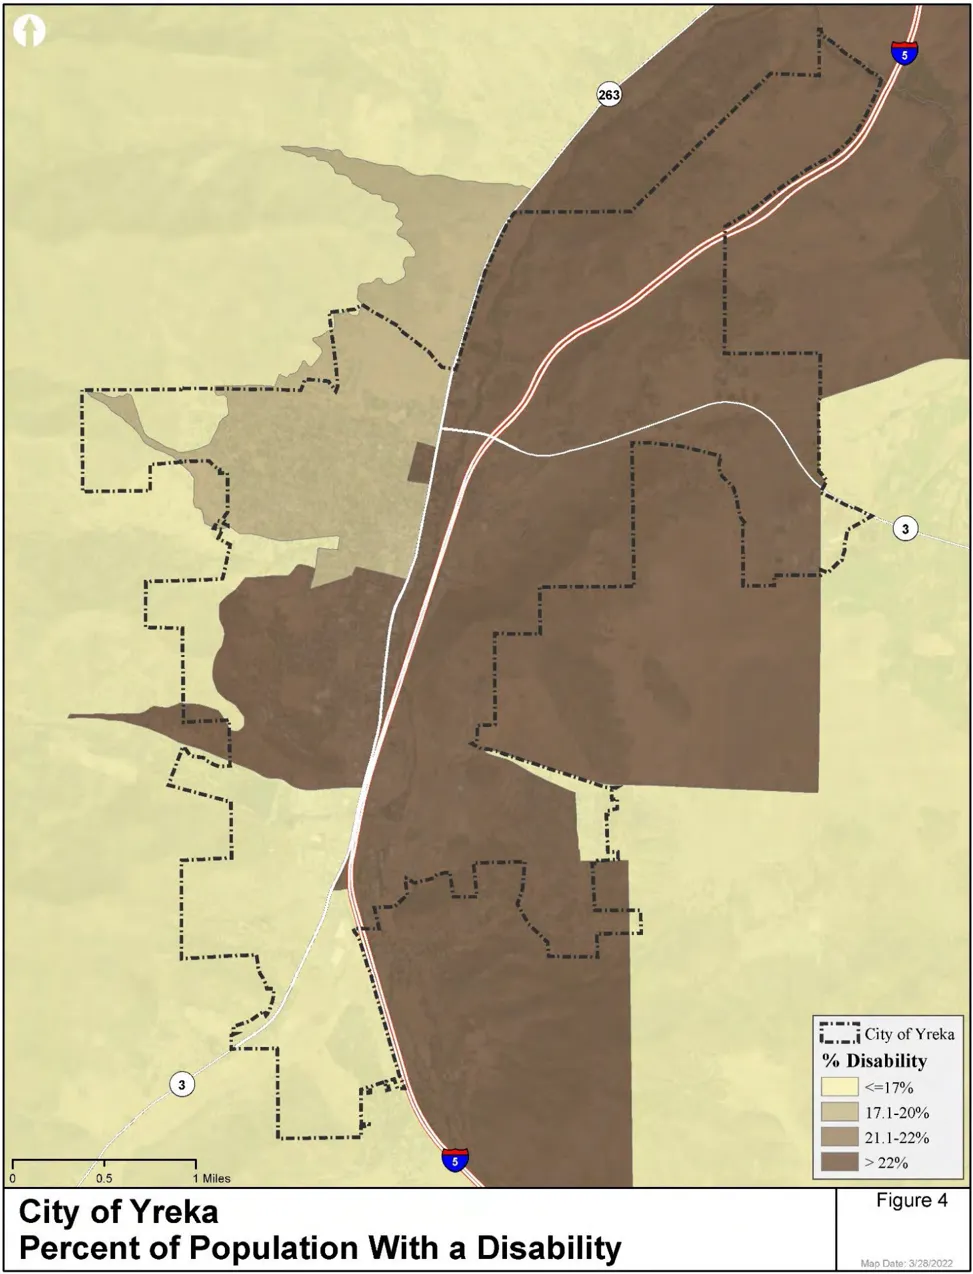
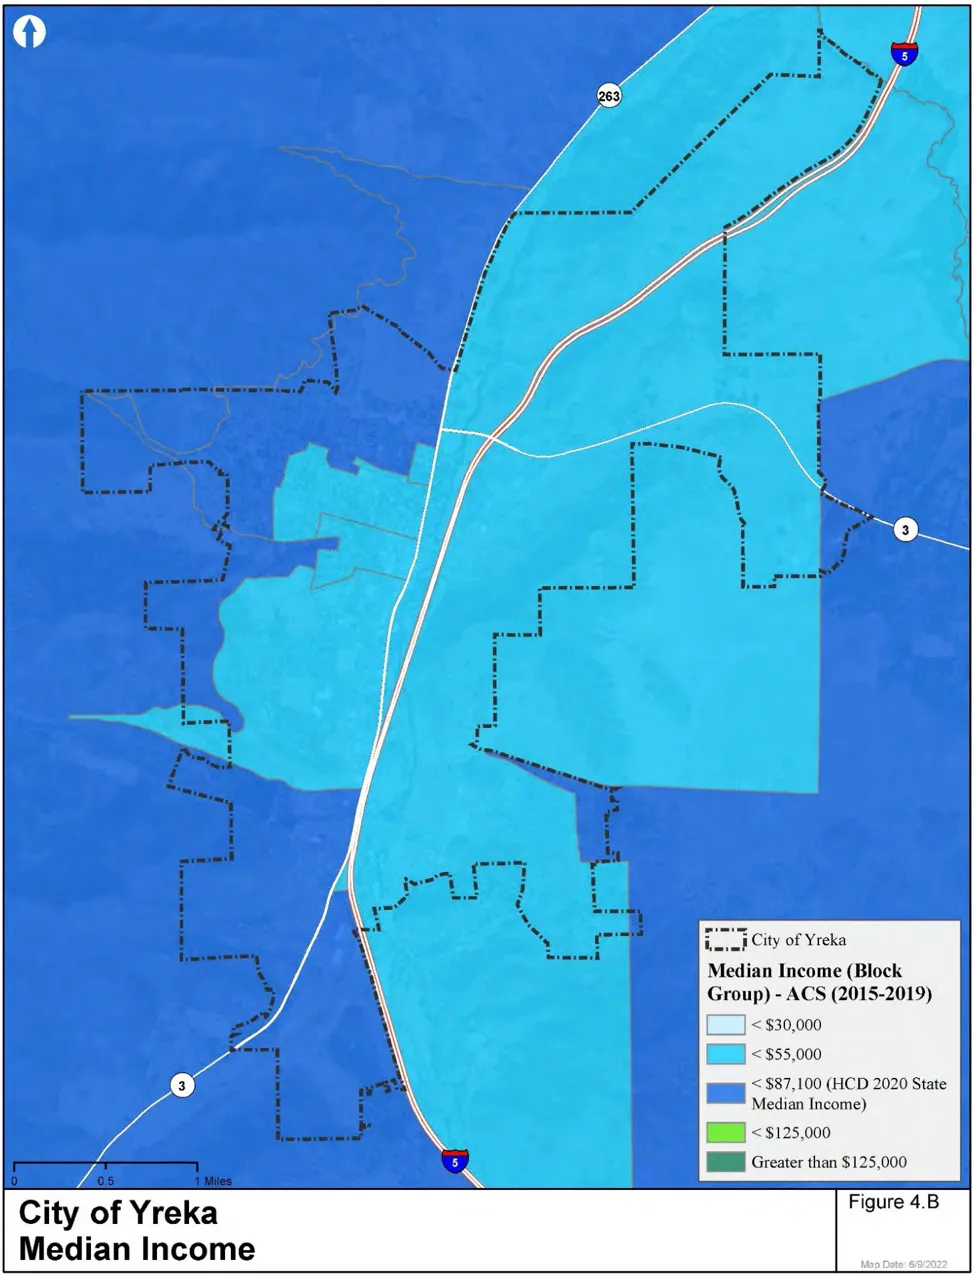
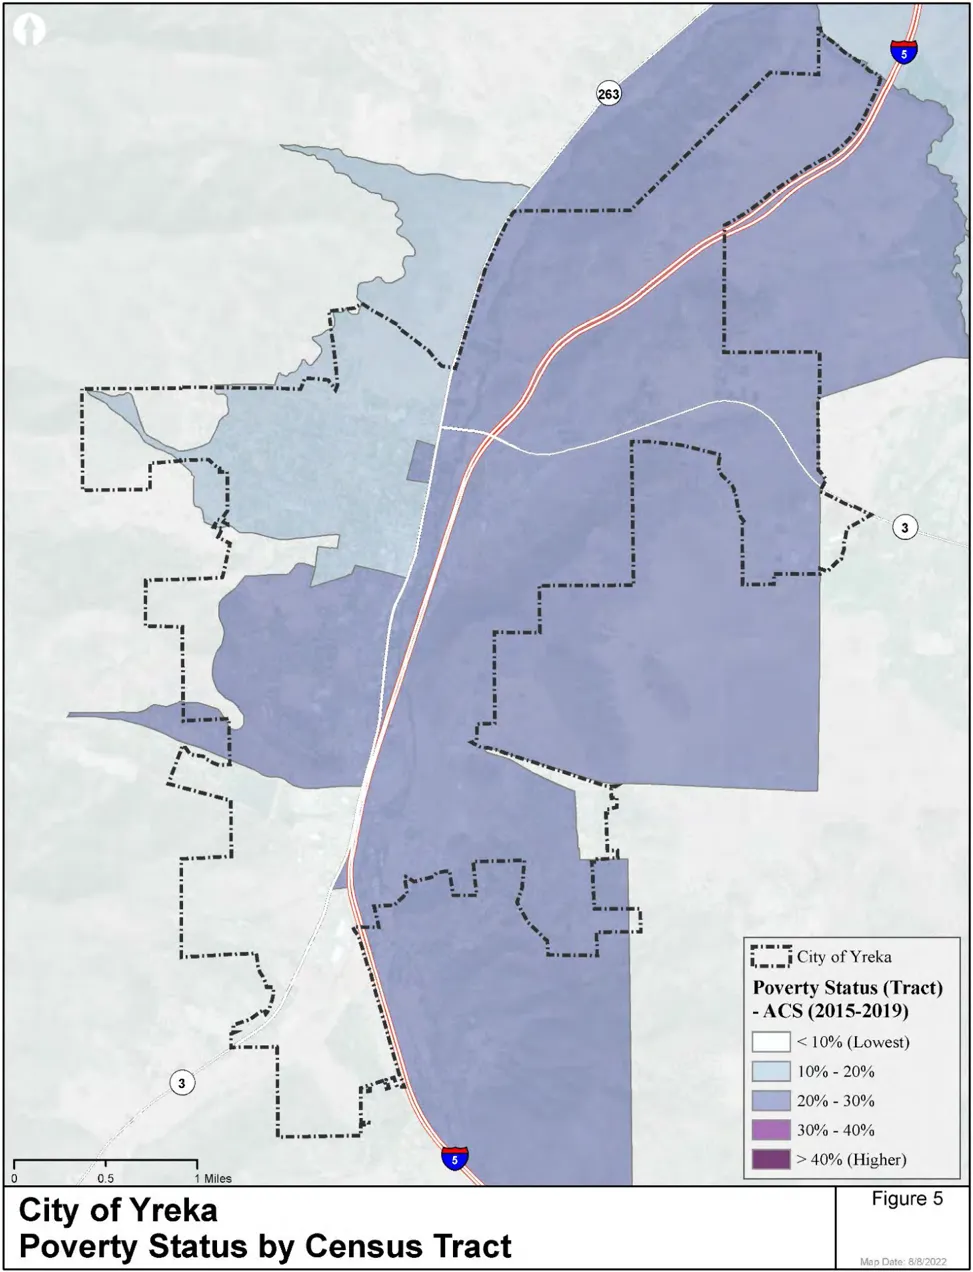
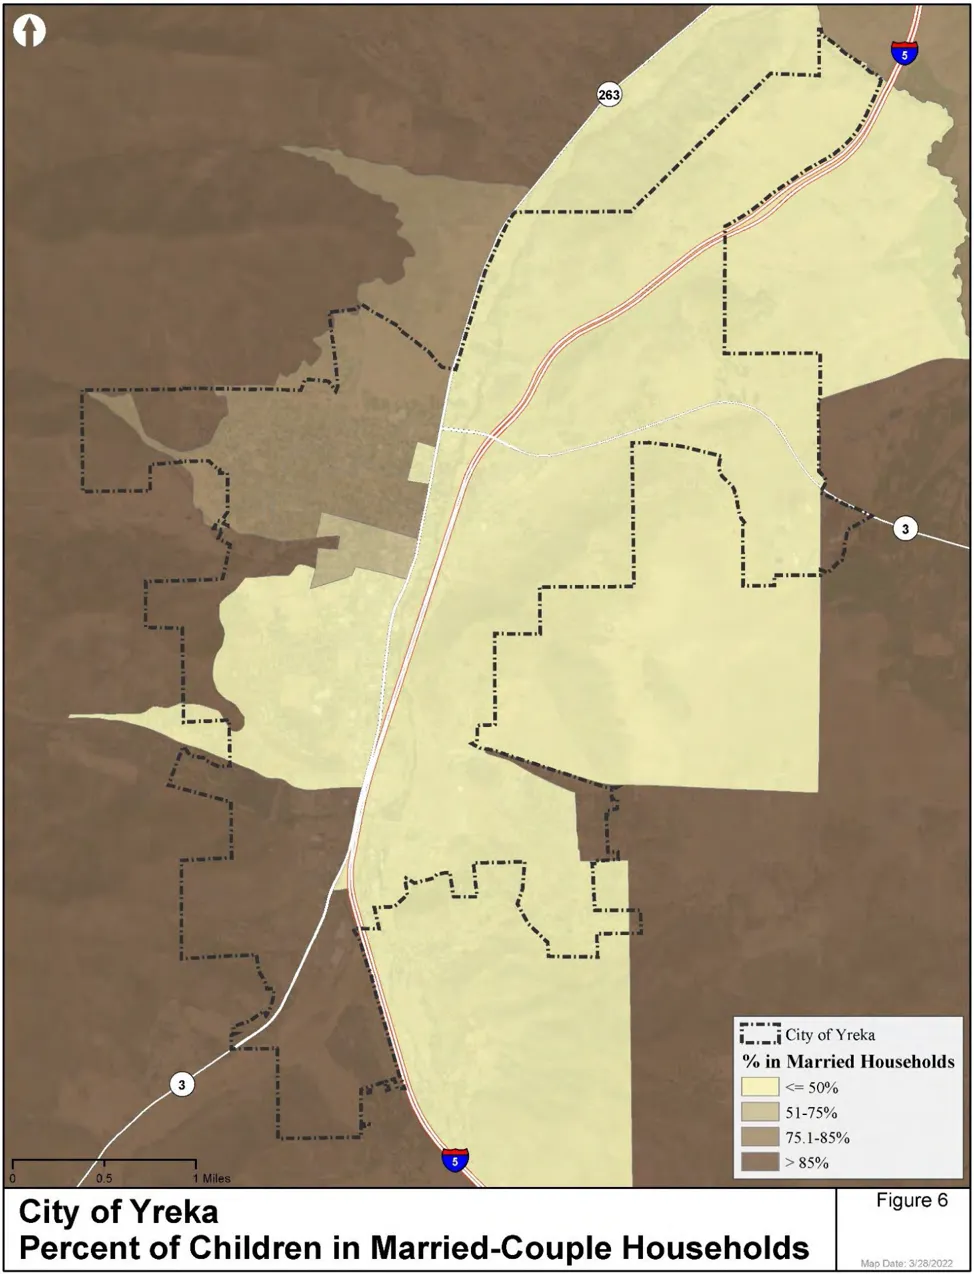
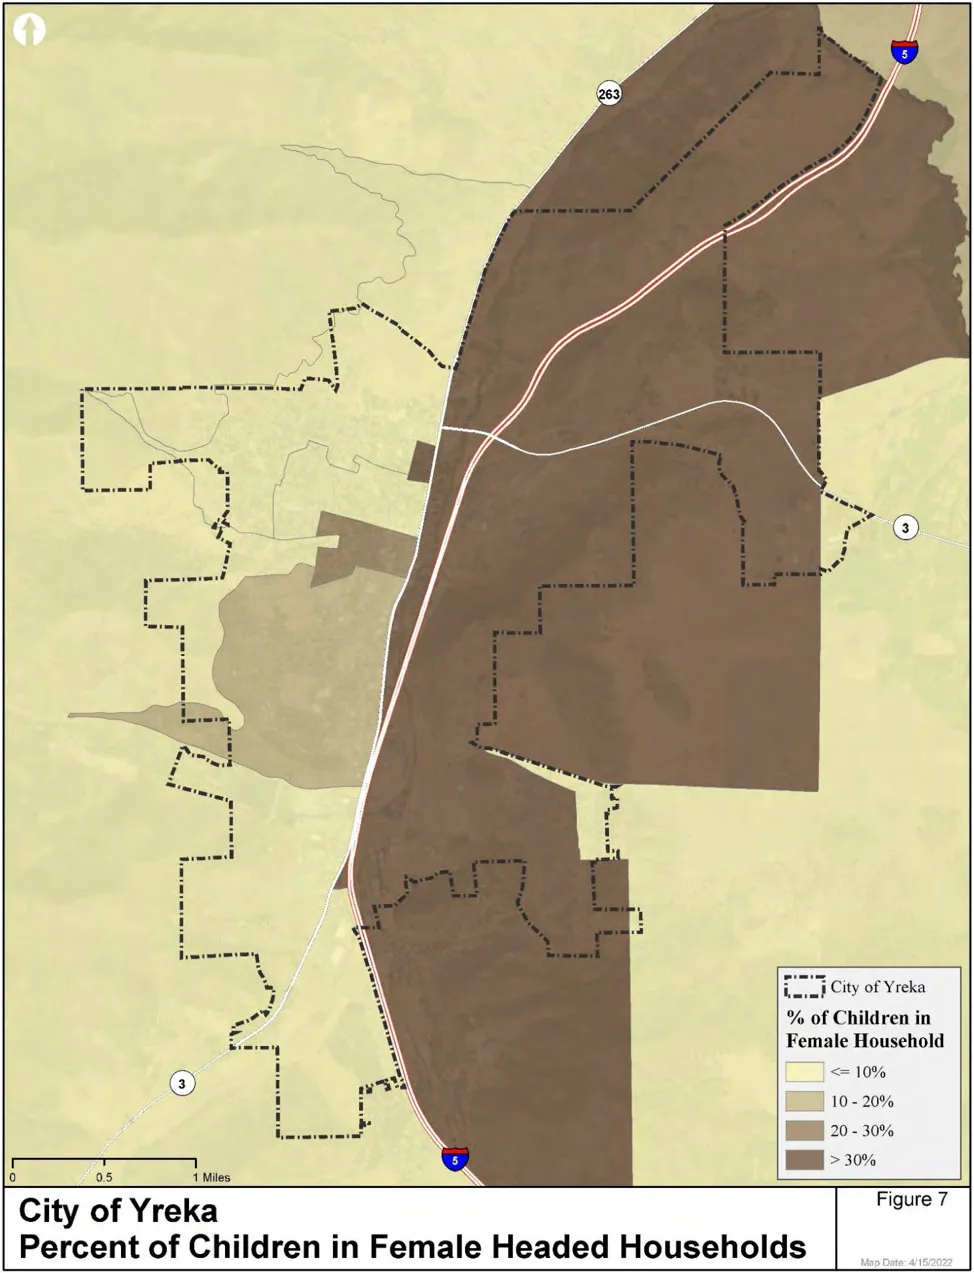
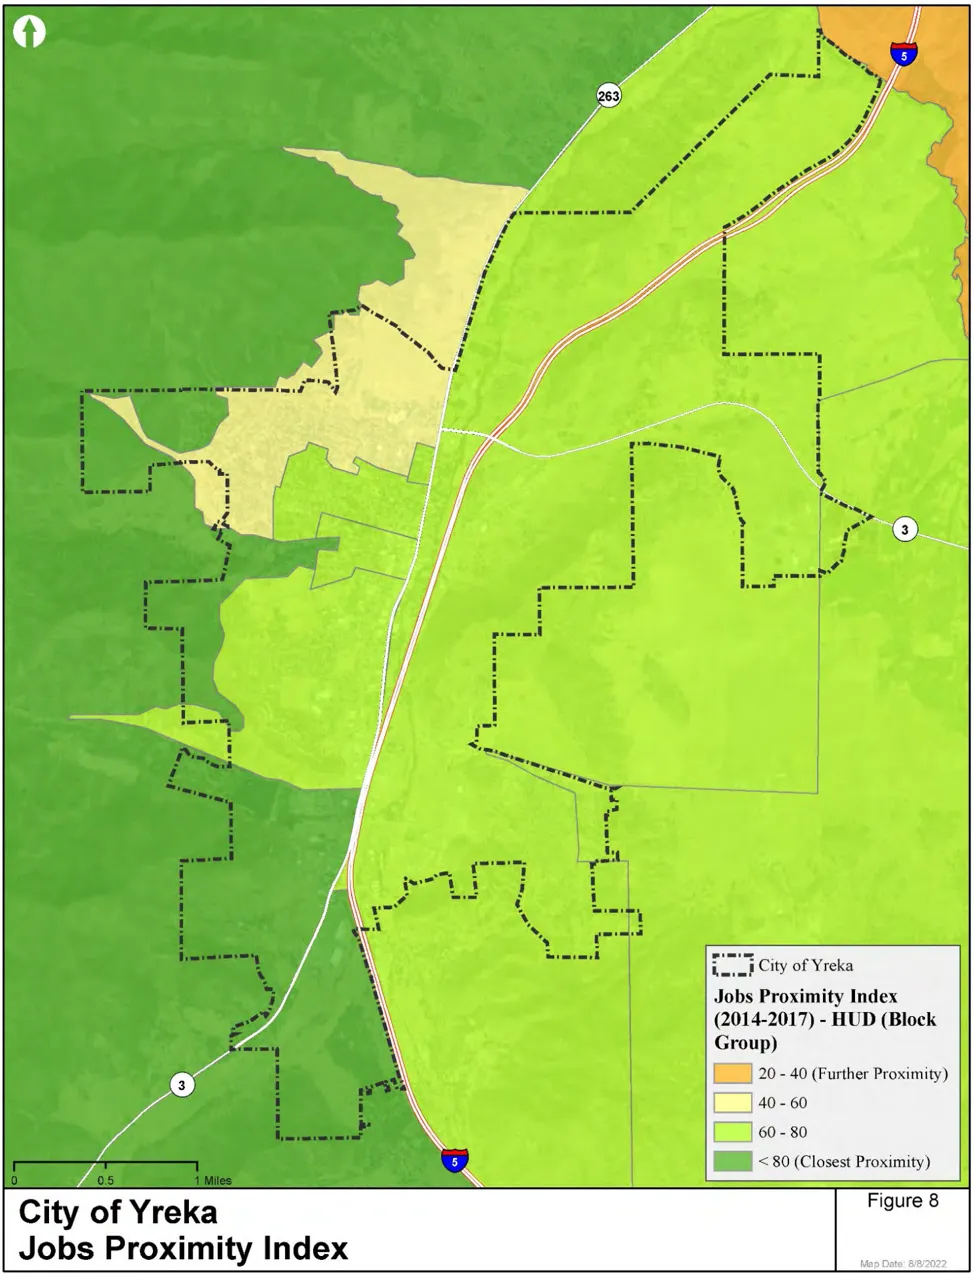
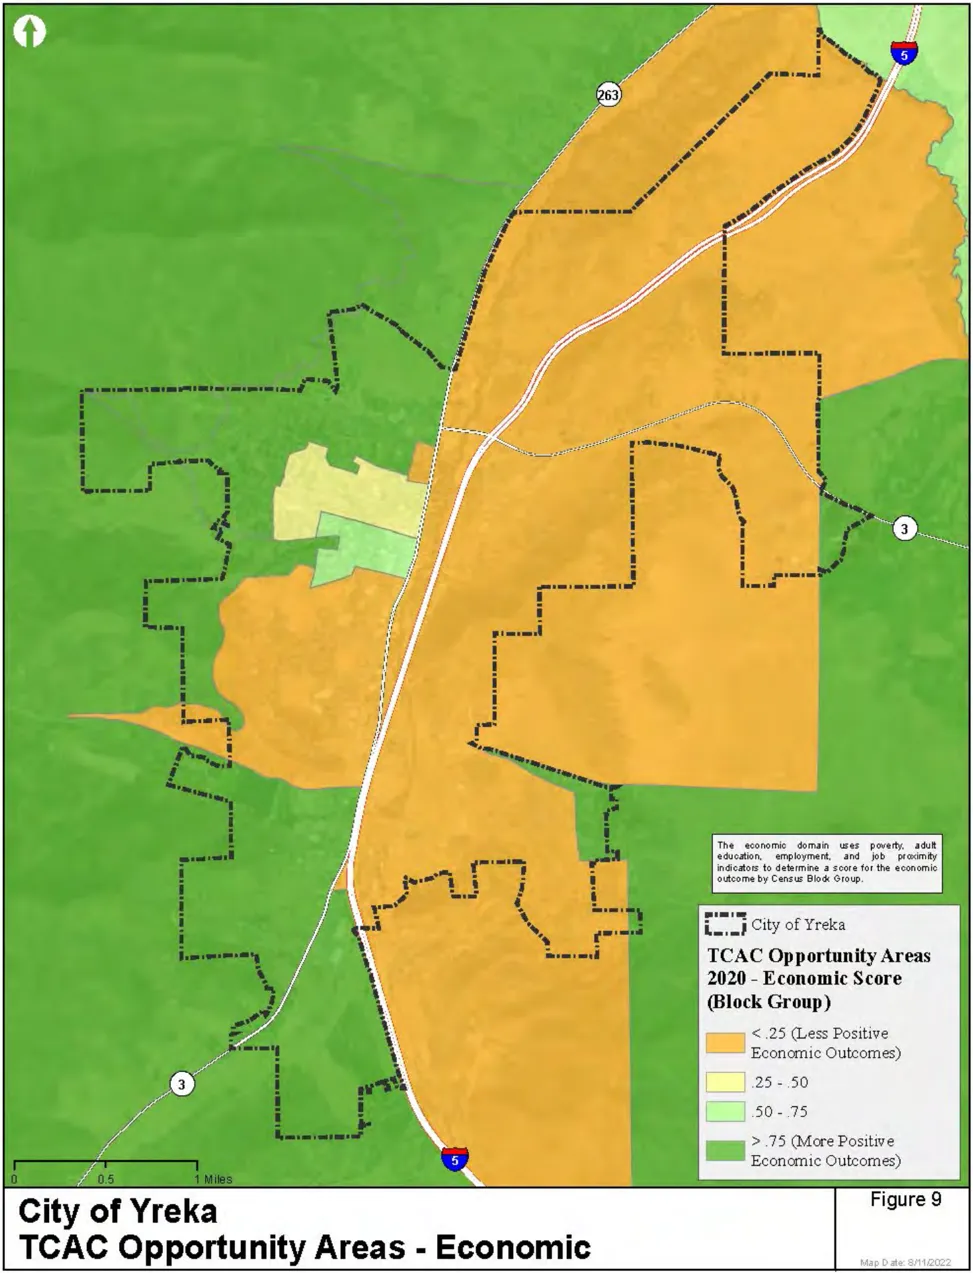
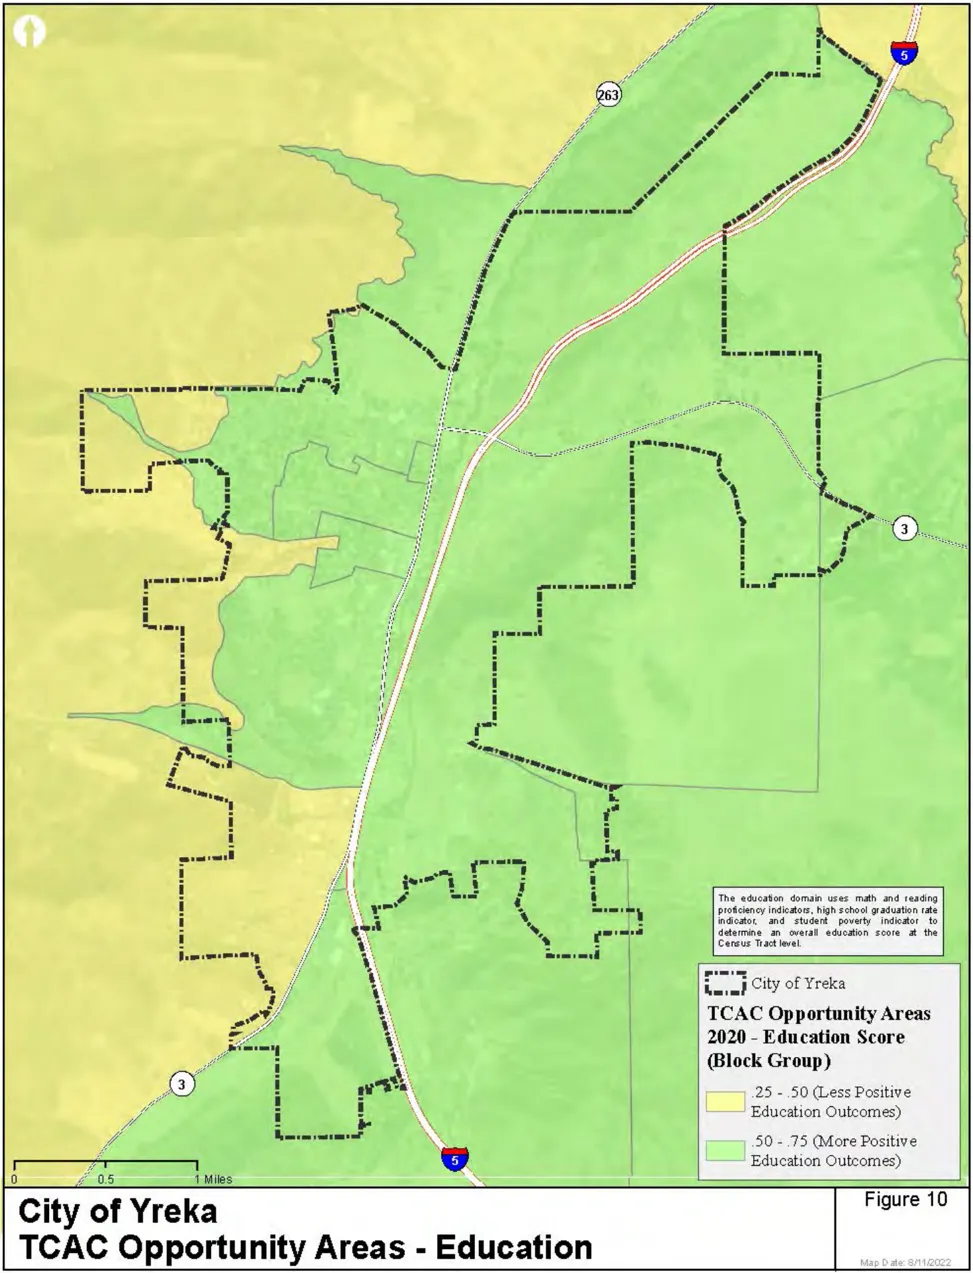
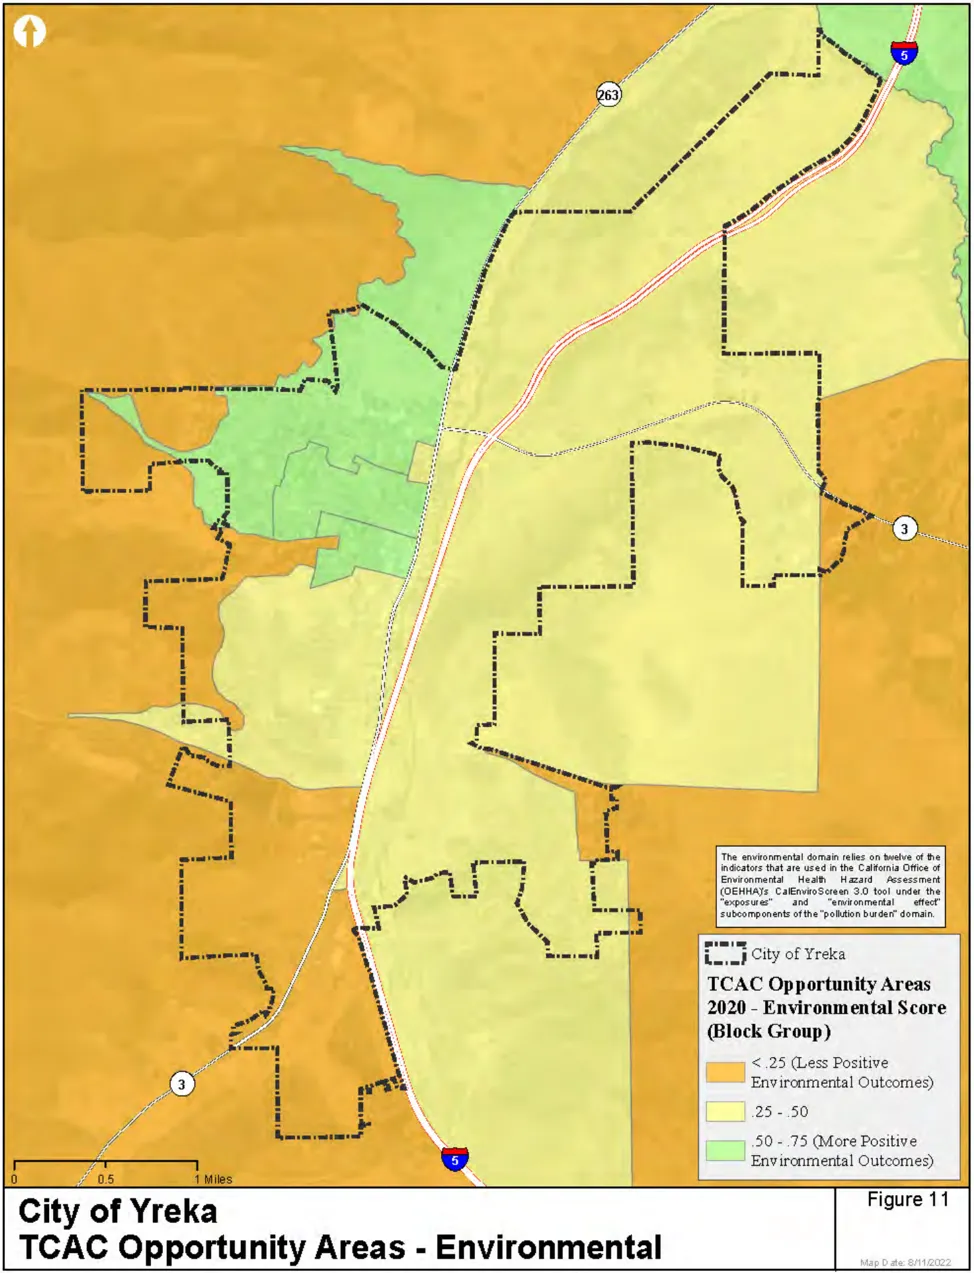
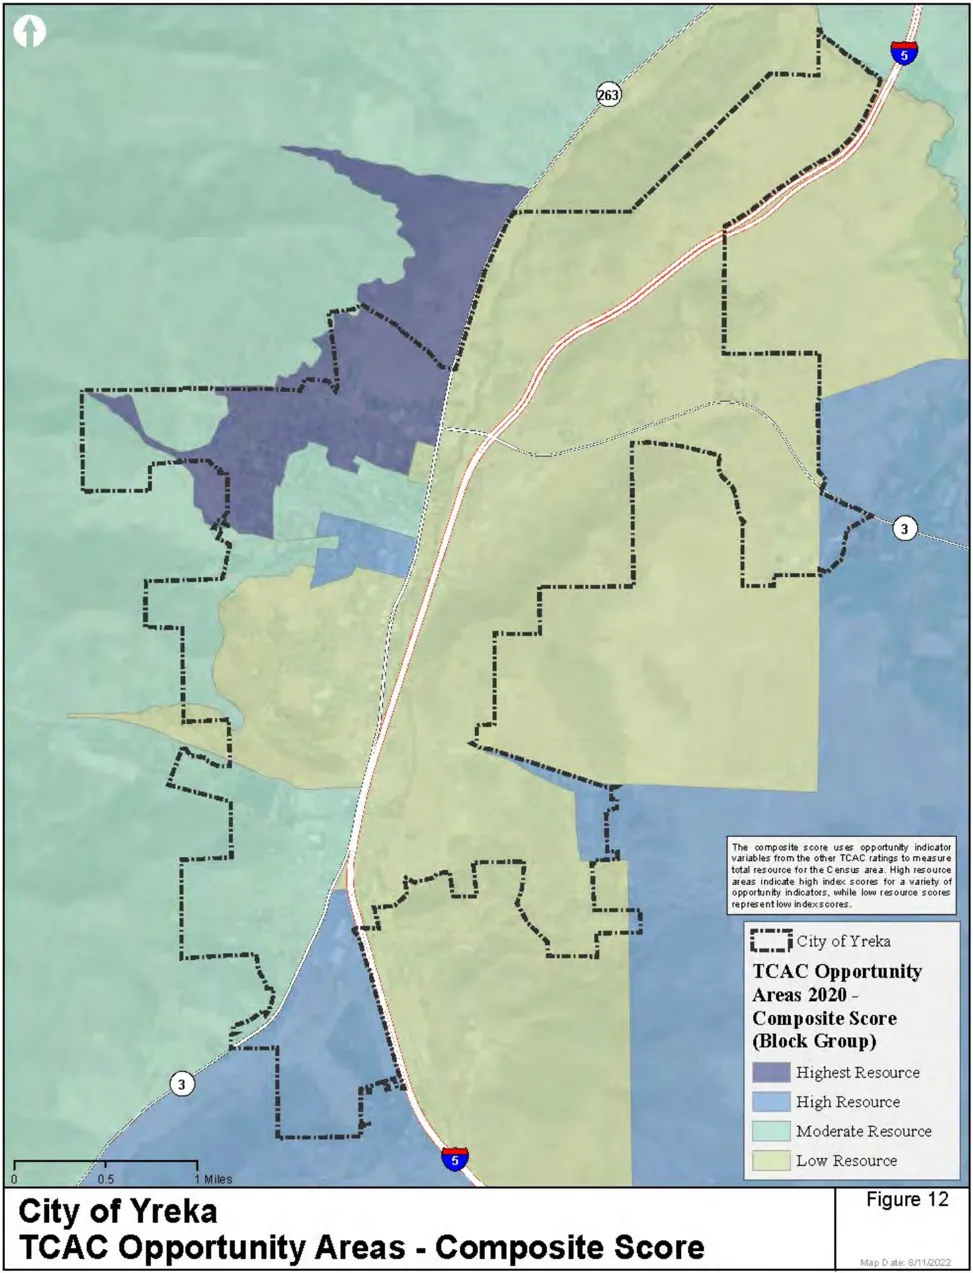
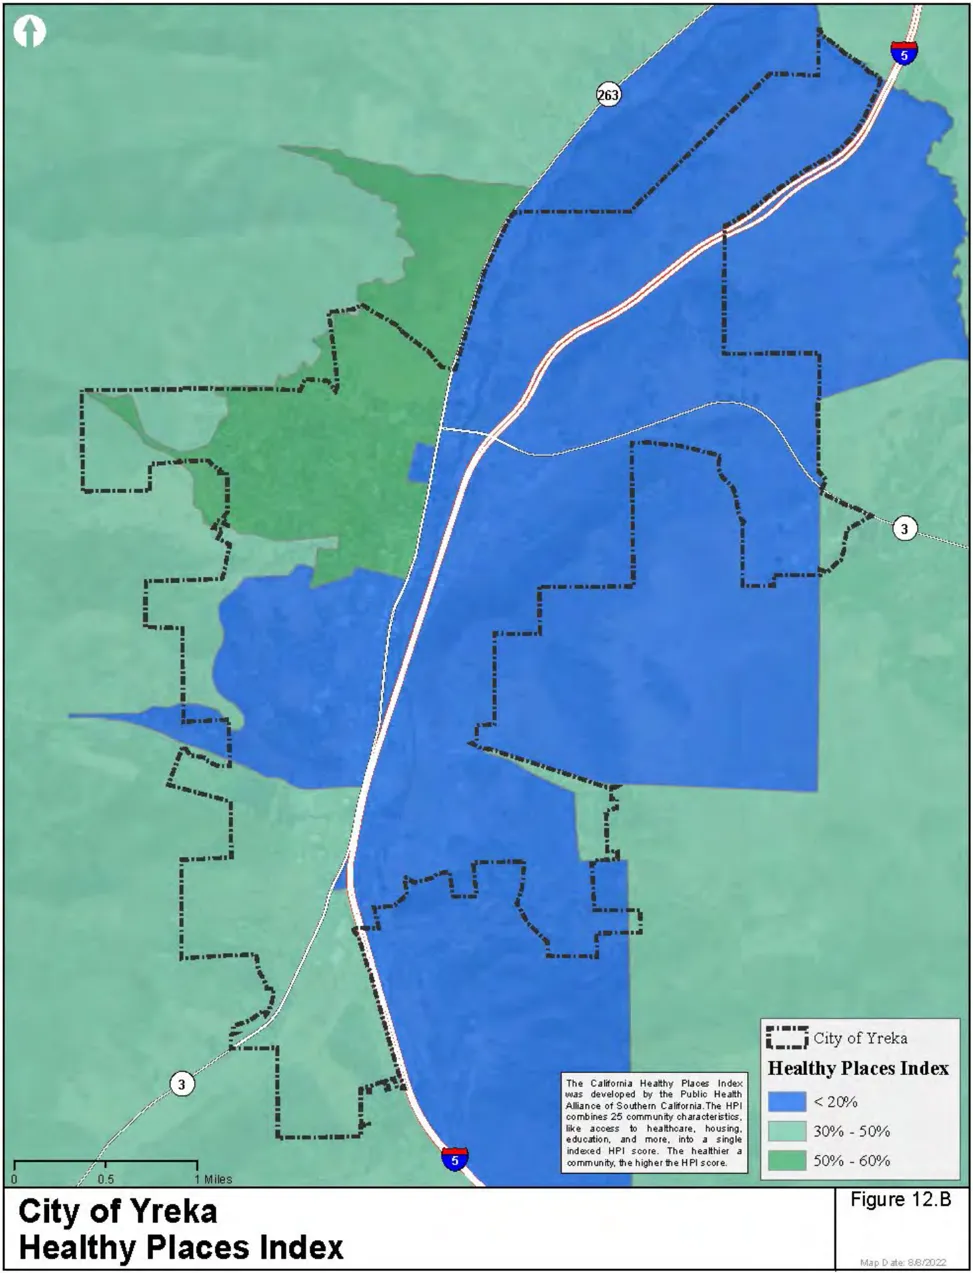
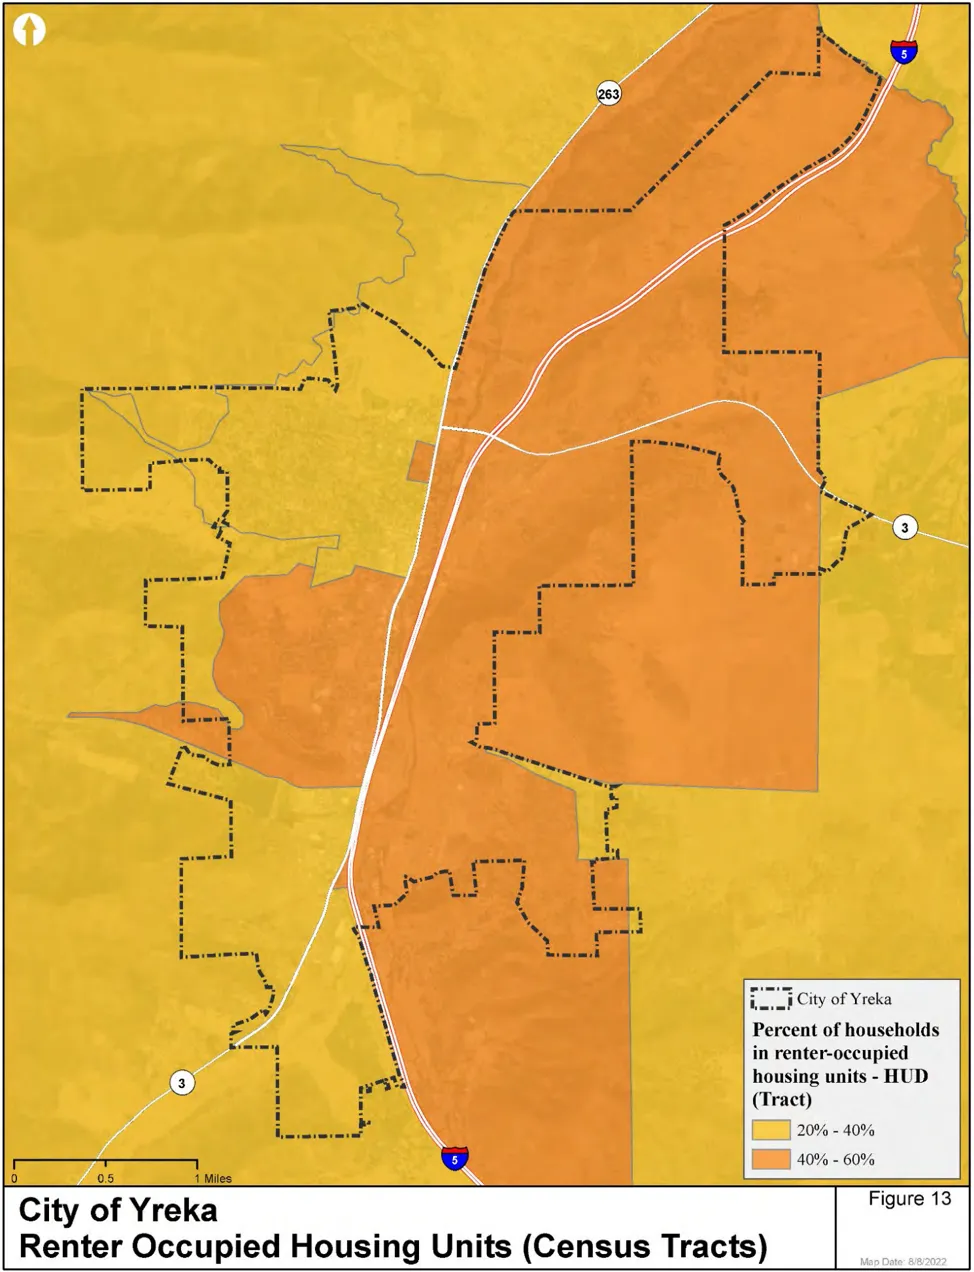
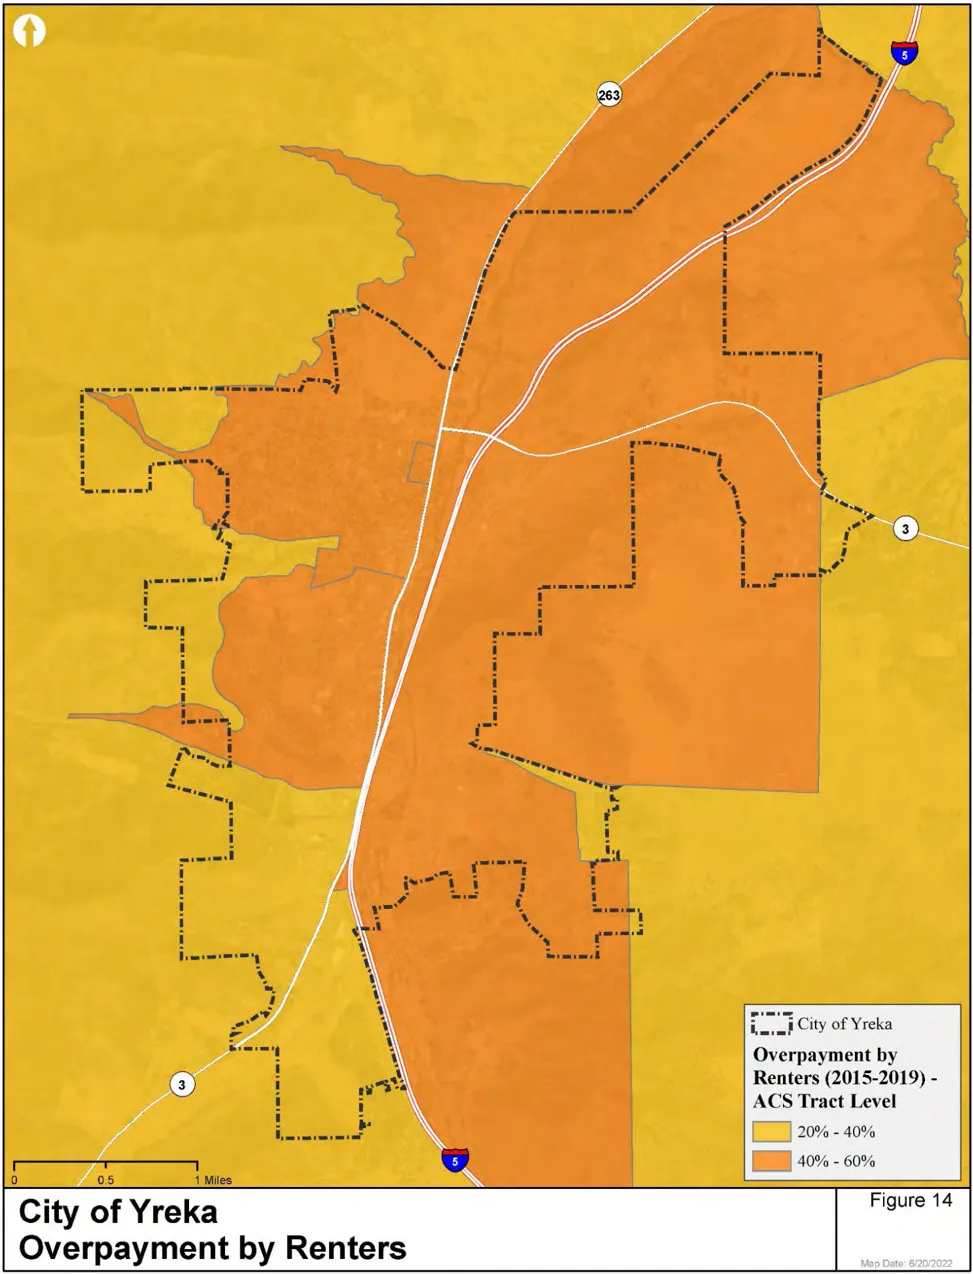
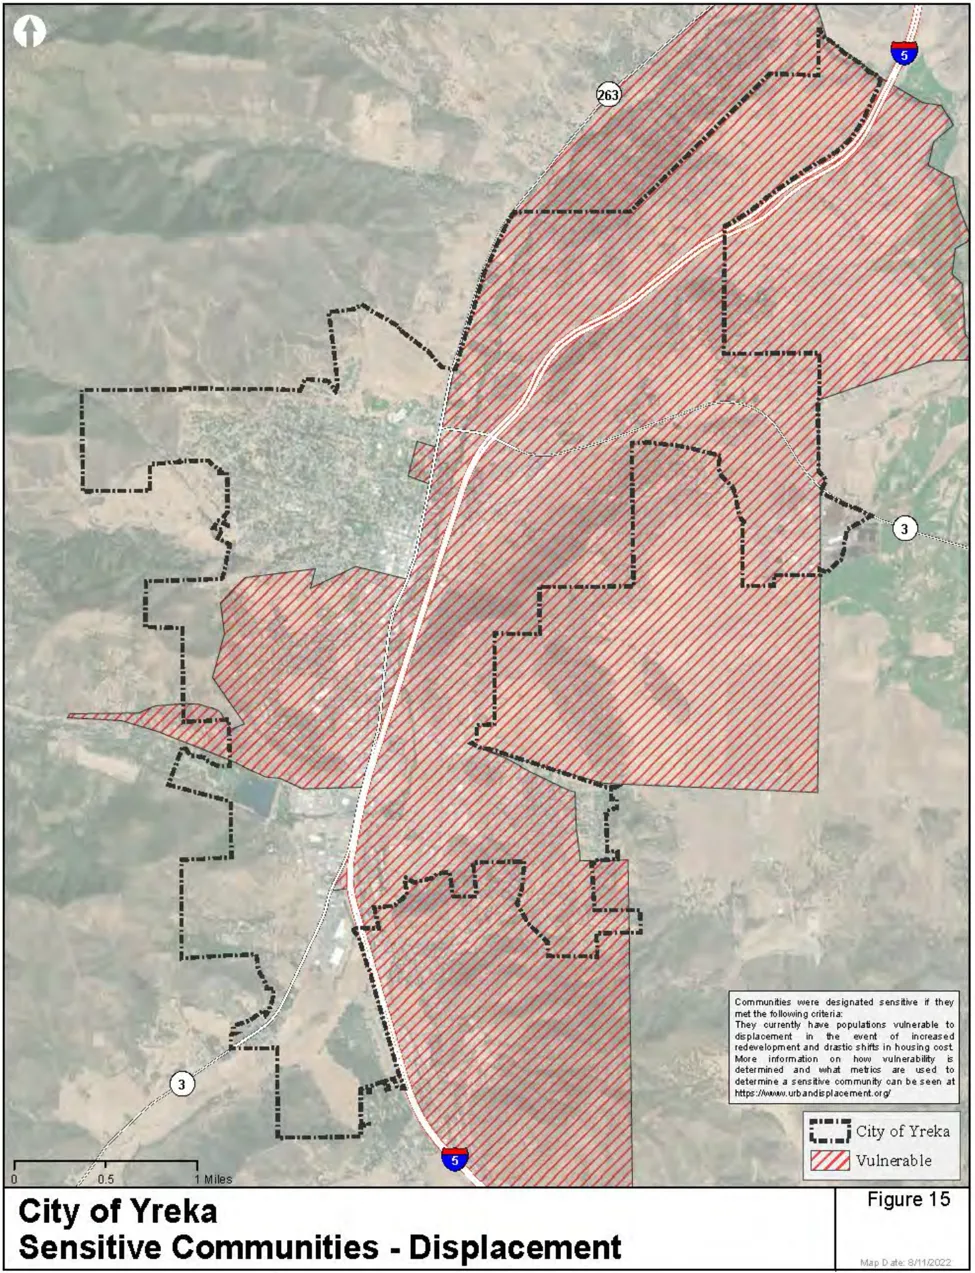
APPENDIX C: INVENTORY OF SITES
Section titled “APPENDIX C: INVENTORY OF SITES”As discussed in section 4.3.6 of Appendix A, the City of Yreka’s regional housing needs allocation for the 6th cycle is two housing units, one low income unit and one very low income unit. APN 053-642-600 is designated to meet the City’s need, and details about the parcel are provided in Table C-1. Pursuant to Government Code Section 66583.2(c)(3), the City is using the default density of 15 dwelling units per acre that allows sites to be deemed appropriate to accommodate housing for lower income households.
APN 053-642-600 is 5.53 acres in size, and is located near the intersection of Juniper Drive and Montague Road. The site is designated by the Yreka General Plan as High Density Residential (HRD), which has maximum allowable density of 16 dwelling units per acre. Consistent with the General Plan and the HRD land use designation, the entirety of the site is zoned and planned for multifamily development with a density range of one to 16 dwelling units per acre (R-3-16). At 100 percent buildout, the site’s full buildout is 89 units could be developed. Both water and sewer services are available at the parcel’s frontage. Dry utilities, i.e., electricity, internet, and phone, are available also at the parcel’s frontage. For the City’s 5th cycle housing element, the site was a designated inventory site. However, it was not a designated inventory site in City’s 4th cycle housing element.
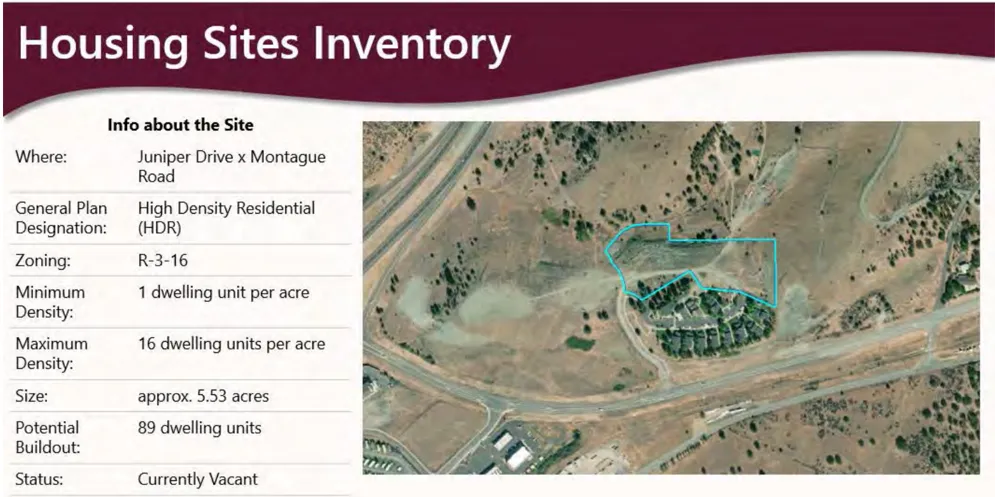
Info about the Site
| Detail | Description |
|---|---|
| Where: | Juniper Drive x Montague Road |
| General Plan Designation: | High Density Residential (HDR) |
| Zoning: | R-3-16 |
| Minimum Density: | 1 dwelling unit per acre |
| Maximum Density: | 16 dwelling units per acre |
| Size: | approx. 5.53 acres |
| Potential Buildout: | 89 dwelling units |
| Status: | Currently Vacant |
To estimate the realistic capacity of APN 053-642-600, the City is using the Siskiyou Crossroads housing project applied for and approved in 2021 as a guide. Siskiyou Crossroads is a 50-unit multifamily development developed on a split zone parcel: R-3-12/M-1. The R-3-12 zone portion of the property is 4 acres, with the remaining 10 acres being zoned M-1 which only allows emergency shelters and does not allow any other residential uses. For the R-3-12 portion of the property the buildout density of the Siskiyou Roads project is 13 dwelling units per acre. One hundred percent of the units are affordable to the target population of 60 percent or less of the area median income, with 24 of the units designated as permanent supportive housing. The Siskiyou Crossroads project indicates the City is capable of achieving 100 percent buildout and for the designated income category. However, it is noted the Siskiyou Crossroads property is County-owned. As government owned property, barriers to acquisition and site control are significantly reduced. For privately owned property, like APN 053-0642-600, the property owner must be willing to sell and the purchase price is likely to include the owner’s estimated return on investment.
The City’s regulatory requirement that multifamily developments configured as more than fourplexes must first secure a CUP is a potentially limiting factor for a housing development achieving the full buildout density. A discount of 30 percent has been applied to account for the potential limits. This adjustment results in a realistic capacity of 62 units which is still more than adequate for the City to meet its RHNA obligation for two lower income units during the 6thc cycle planning period.
1. AFFIRMATIVELY FURTHERING FAIR HOUSING ANALYSIS OF SITES INVENTORY
Section titled “1. AFFIRMATIVELY FURTHERING FAIR HOUSING ANALYSIS OF SITES INVENTORY”APN 053-642-600, the site identified in the City’s inventory, was one of 19 sites evaluated in 2019 by Housing Tools for feasibility for a permanent supportive housing development and was supported by No Place Like Home (NPLH) program funding. The target population for permanent supportive housing aligns with the income of very low income households. The feasibility evaluation considered and ranked potential for neighborhood integration using the measures listed below. These four measures are indicators for AFFH:
- What is the site’s proximity to public transportation and services (grocery stores, parks, schools, libraries, hospitals and clinics, pharmacies)?
- How walkable is the neighborhood?
- Are adjacent land uses compatible with affordable housing?
- How likely is it that the development would receive neighborhood opposition?
The above attributes were verified by conducting site visits, and interviewing local government officials and a local real estate professional. APN 053-652-600 is ranked in the Tier 2, receiving 10 points (out of a possible 12). For the neighborhood integration subcategory, the site scored 2 points (out of a possible 3). The site’s attributes that resulted in the score are:
Pros: The site is within 1 mile of Grocery Outlet, a bus stop serviced by five bus lines, Newton Park, Ringe Park, Yreka High School, and Yreka Immediate Care Clinic.
Cons: The site is not as well integrated into the community and as pedestrian-friendly as many of the other sites analyzed
The Housing Tools study also noted that the site is adjacent to the Juniper Apartment development, which is an affordable rental complex. Otherwise, the surrounding adjacent land is vacant. Despite being surrounded by vacant land, the property is close to a number of services by way of Montague Road to West Yreka, including Grocery Outlet, a bus stop serviced by five bus lines, two parks and Yreka High School.
The site is located in a Low Resource area, however, according to the 2021 TCAC Opportunity Areas composite mapping. The Housing Element includes a number of programs that directly aim to improve opportunities in the higher resource areas of the City. The programs to increase the variety of housing types, to support and encourage property owners to consider ADU and SB 9 (2021) housing development, seek federal and state funding for enable lower income households to make repairs to their homes to improve the conditions of to support a that for housing development.
APPENDIX D - FUNDING RESOURCES
Section titled “APPENDIX D - FUNDING RESOURCES”Appendix D focuses on governmental funding programs that support housing development. While this Appendix does not attempt to identify funding available from private organizations, the City is interested in supporting housing projects seeking funding through other channels. There are numerous active federal and state funding programs. Each program has administrative regulations that specify who may be eligible to apply for program funding. Some programs allow housing developers to apply directly, and only allow governmental agencies, i.e., a city or a housing authority, to apply for funding. Many of the programs stipulate only ‘shovel ready’ projects are eligible. State and federal funding that may be used to off-set acquisition and pre-development costs are limited. Almost unilaterally programs are highly competitive and oversubscribed. Almost all programs for housing construction are income qualified and require enforceable covenants to assure affordability.
Some of programs that are administered by the California Department of Housing and Community Development (HCD) are noted as being currently archived. An archived program means the program does not currently have funding allocated by the Legislature. Archived programs may have projects that in asset management and compliance phases. Archived may become active if the Legislature allocates funding to the program.
The following funding programs may be able to assist the City in meeting its affordable housing goals:
Federal Programs
Section titled “Federal Programs”| Program Name | Description | Eligible Activities |
|---|---|---|
| Community Development Block Grant (CDBG) Program | The Department of Housing and Urban Development (HUD) awards Community Development Block Grants annually to entitlement jurisdictions and states for general activities, including housing, and economic development activities. HUD also offers various other programs that can be utilized by the City and nonprofit and for-profit agencies for the preservation of low-income housing units such as Section 202 and Section 108 loan guarantees. The annual appropriation for CDBG is split between states and local jurisdictions called ‘entitlement communities.’ |
|
| HOME Investment Partnerships Program | The Home Investment Partnerships Program (HOME) was created under the Cranston Gonzalez National Affordable Housing Act enacted in November 1990. HOME funds are awarded annually as formula grants to participating jurisdictions. HUD establishes Home Investment Trust Funds for each grantee, providing a line of credit that the jurisdiction may draw upon as needed. The program’s flexibility allows states and local governments to use HOME funds for grants, direct loans, loan guarantees, or other forms of credit enhancement or rental assistance or security deposits. |
|
| Housing Choice Voucher (HCV) Rental Assistance (Section 8) | Provides rental assistance payments to owners of market-rate properties on behalf of very-low-income tenants. | Rental Assistance. Public housing agencies (PHA) administer HCVs. While the City cannot directly administer HCVs, the City can continue to work with the local PHAs, e.g., Shasta County Housing Authority and the Karuk Tribe Housing Authority, on the HCV administration and support their efforts. Further, the City can partner with these agencies to ensure there are adequate units available, and facilitate housing developments that will utilize project-based rental assistance. |
| Section 811 | Provides grants to nonprofit developers of supportive housing for disabled persons. The grants may be used to construct or rehabilitate group homes, independent living facilities, and intermediate care facilities. The grants may also have a rental assistance component. |
|
| Section 203(k) | Provides fixed-rate, low-interest loans to organizations wishing to acquire and rehabilitate property. |
|
| Section 202 | Grants to private nonprofit developers of supportive housing for very low-income seniors. | New Construction |
| Low Income Housing Tax Credits (LIHTC) | In 1986, Congress created the federal Low Income Housing Tax Credits to encourage private investment in the acquisition, rehabilitation, and construction of low-income rental housing. Because high housing costs in California make it difficult, even with federal credits, to produce affordable rental housing, the California legislature created a state low-income housing tax credit program to supplement the federal credit. The state credit is essentially identical to the federal credit, the Tax Credit Allocation Committee allocates both, and state credits are only available to projects receiving federal credits. Twenty percent of federal credits are reserved for rural areas and 10 percent for nonprofit sponsors. To compete for the credit, rental housing developments have to reserve units at affordable rents to households at or below 46 percent of area median income. The targeted units must be reserved for the target population for 55 years. | New Construction |
| Mortgage Credit Certificate Program | Offers income tax credits to first-time homebuyers. The County distributes the credits. | Homebuyer Assistance |
| Supportive Housing Program (SHP) | Offers grants to agencies who offer supportive housing and services to the homeless. | Transitional Housing, housing for persons with disabilities, supportive housing, and support services |
| Community Reinvestment Act | The Community Reinvestment Act (CRA), enacted by Congress in 1977, is intended to encourage depository institutions to help meet the credit needs of the communities in which they operate, including low- and moderate-income neighborhoods, consistent with safe and sound banking operations. The CRA requires that each insured depository institution’s record in helping meet the credit needs of its entire community be evaluated periodically. That record is taken into account in considering an institution’s application for deposit facilities, including mergers and acquisitions. |
|
State Programs: Administered by the California Department of Housing and Community Development (HCD)
Section titled “State Programs: Administered by the California Department of Housing and Community Development (HCD)”| Program Name | Description | Eligible Activities |
|---|---|---|
| Emergency Solutions Grant | Awards grants to nonprofits for the provision of shelter support services. | Support Services |
| Multi-Family Housing Program (MHP) | Provides loans for new construction, rehabilitation, and preservation of affordable rental housing. Payments on the loans are deferred for a specified period of time. |
|
| CalHOME | Provides grants to local governments and nonprofit agencies for homebuyer assistance, rehabilitation, and new construction. The agency also finances acquisition, rehabilitation, and replacement of manufactured homes. |
|
| California Self-Help Housing Program | Provides grants for the administration of mutual self-help housing projects. |
|
| Emergency Housing and Assistance Program | Provides grants to support emergency housing. | Shelters and transitional housing. This program is currently archived. |
| Affordable Housing and Sustainable Communities Program | Provides funding to support infill development projects with the goal of reducing greenhouse gas emissions. |
|
| Veterans Housing and Homeless Prevention Program | Provides funding to buy, construct, rehabilitate or preserve affordable multi-family housing for veterans and their families. |
|
| SB 2 - Building Jobs and Homes Act | Provides planning grant funding to jurisdictions for plans and process improvements that will help to accelerate housing production. |
|
| Local Early Action Planning (LEAP) Grants | The Local Action Planning Grants (LEAP), provides over-the-counter grants complemented with technical assistance to local governments for the preparation and adoption of planning documents, and process improvements that:
|
|
| No Place Like Home | Through a County application process, provides loans to acquire, develop, preserve, or rehabilitate permanent supportive housing facilities. | Permanent Supportive Housing |
| Infrastructure Infill Grant | Provides gap financing for infrastructure improvements necessary to support the development of affordable infill housing. | Infrastructure Improvements. Developers of qualifying housing projects and local governments may both apply for this funding program. |
| Local Housing Trust Fund Program | Provides matching grants to funds provided by Local Housing Trust Funds. |
|
| Transit Oriented Development Program | Supports the development of affordable multi-family rental housing near transit stations through low-interest loans. | New construction, rehabilitation, and infrastructure improvements. This program is currently archived. |
| CA Covid-19 Rent Relief Program | Provides local governments in California with emergency rental assistance funds. | For local governments and tribes within California seeking Emergency Rental Assistance Funds. |
| Excess Sites Local Government Matching Grants Program | Provides grant funding to support and accelerate selected affordable housing projects on excess state sites. | This program is specifically earmarked for State lands designated as excess pursuant to Executive Order (EO) N-06-19 for Affordable Housing Development. At this time there are no excess State sites designated in the City of Yreka or sites under consideration, therefore the City would not be eligible for funding. |
| Foreclosure Intervention Housing Preservation Program | Provides funds to preserve affordable housing and promote resident or nonprofit organization ownership of residential real property at risk for foreclosure or in the process of foreclosure. | The purpose of this program is to preserve affordable housing and promote resident or nonprofit organization ownership of residential real property. Funds are to be made available as loans or grants to eligible borrowers to acquire and rehabilitate properties at risk of foreclosure or in the foreclosure process. |
| Golden State Acquisition Fund | Provides developers with loans for acquisition or preservation of affordable housing. |
|
| HOME American Rescue Plan | Provides assistance to individuals or households that may be at risk for or experiencing homelessness, and other vulnerable populations. |
|
| Homekey | Provides grants for acquiring and rehabilitating a variety of housing types to help rapidly expand housing for persons experiencing or at risk of homelessness. |
|
| Housing for Healthy California | Provides funds for the creation and support of new and existing permanent supportive housing for people experiencing chronic homelessness or are homeless and high-cost health users. | Acquisition and/or new construction |
| Housing Navigators Program | Provides funds to counties for the support of housing navigators meant to help young adults aged 18-21 years secure and maintain housing, prioritizing young adults in the foster care system. |
|
| Joe Serna, Jr. Farmworker Housing Grant Program | Provides funds for new construction, rehabilitation, and acquisition of owner-occupied and rental units for agricultural workers, prioritizing lower income households. |
|
| Mobilehome Park Rehabilitation and Resident Ownership Program | Provides low-interest loans for financing the preservation of affordable mobilehome parks for ownership or control by resident organizations, nonprofit housing sponsors, or local public agencies. |
|
| Permanent Local Housing Allocation | Provides grant funding to local governments for housing-related projects and programs that assist in addressing the unmet housing needs of their local communities. |
|
| Pet Assistance and Support Program | Provides grant funding for homeless shelters for pet shelter, food, and basic veterinary services for pets owned by persons experiencing homelessness. |
|
| Portfolio Reinvestment Program | Provides funds to rehabilitate and extend the long-term affordability of HCD-funded housing projects. |
|
| Regional Early Action Planning Grants | Provides support for transformative planning and implementation of activities meant to accelerate infill and affordable developments. |
|
| Accelerator | Provides gap funding for the replacement of tax credit equity in shovel-ready projects in order to reduce the backlog of projects in the CDLAC funding pipeline and accelerate the development of housing to those in need | Multifamily Housing |
State Programs: Administered by California Housing Finance Agency (CalHFA)
Section titled “State Programs: Administered by California Housing Finance Agency (CalHFA)”| Program Name | Description | Eligible Activities |
|---|---|---|
| Affordable Housing Partnership Program (AHPP) | Provides lower interest rate CalHFA loans to homebuyers who receive local secondary financing. | Homebuyer Assistance |
| Self-Help Builder Assistance Program | Provides lower interest rate CalHFA loans to owner-builders who participate in mutual self-help housing projects. Also provides site acquisition, development financing, and construction financing for self-help projects. |
|
| California Housing Assistance Program | Provides 3% silent second loans in conjunction with 97% CalHFA first loans to give eligible homebuyers 100% financing. | Homebuyer Assistance |
| Extra Credit Teacher Program | Provides $7,500 silent second loan with forgivable interest in conjunction with lower-interest-rate CalHFA first loans to assist eligible teachers in buying homes. | Homebuyer Assistance |
| Housing Enabled by Local Partnerships | Provides 3% interest rate loans, with repayment terms up to 10 years, to local government entities for locally determined affordable housing priorities. | Wide Range of Eligible Activities |
| Predevelopment Loan Program | The California Department of Housing and Community Development (HCD) administers the program, which provides funds to pay the initial costs of developing affordable housing developments. Priority is given to applications with matching financing from local redevelopment agencies or federal programs. | Pre-development |
| Multifamily Housing Program | HCD conducts the acquisition and rehabilitation component of the Multifamily Housing Program to acquire and rehabilitate existing affordable rental housing. Priority is given to projects currently subject to regulatory restrictions that may be terminated. Assistance is provided through low interest construction and permanent loans. Eligible applicants include local government agencies, private nonprofit organizations, and for-profit organizations. |
|
| Transitional Housing Program for Emancipated Foster/Probation Youth (THP-Plus) | This program provides funds for housing and services for persons who need support services for transition-age youth. |
|
| Special Needs Housing Program | Allows local governments to use Mental Health Services Act (MHSA) funds to finance the development of permanent supportive rental housing. |
|
| Home Mortgage Purchase Program | CalHFA sells bonds to raise funds for providing below-market-rate loans to qualifying first-time homebuyers. | Homebuyer Assistance |
| ADU Grant Program | Provides funding to reimburse pre-development and non-recurring closing costs associated with the construction of the ADU for income-qualified applicants. Predevelopment costs include site prep, architectural designs, permits, soil tests, impact fees, property survey, and energy reports. | New construction of an Accessory Dwelling Unit, or conversion of an existing accessory structure to an Accessory Dwelling Unit. |
Local Program and Private Sources
Section titled “Local Program and Private Sources”| Program Name | Description | Eligible Activities |
|---|---|---|
| Federal Home Loan Bank System | Facilitates affordable housing programs (AHP), which subsidize the interest rates for affordable housing. The San Francisco Federal Home Loan Bank District provides local service in California. Interest rate subsidies under the AHP can be used to finance the purchase, construction, and/or rehabilitation of rental housing. Very-low-income households must occupy at least 20% of the units for the useful life of the housing or the mortgage term. |
|
| Tax Exempt Housing Revenue Bond | Housing mortgage revenue bonds can be provided, which require the developer to lease a fixed percentage of the units to low-income families at specific rental rates. |
|
| Federal National Mortgage Association (Fannie Mae) | Fannie Mae offers a variety of mortgages, including traditional fixed-rate, low down-payment for underserved low-income areas, and mortgages that fund the purchase and rehabilitation of a home. |
|
| California Community Reinvestment Corporation | Nonprofit mortgage banking consortium designed to provide long-term debt financing for affordable multi-family rental housing. Nonprofit and for-profit developers contact member banks. |
|
| Freddie Mac HomeOne and Renovation Mortgages | Provides down-payment assistance to first-time homebuyers and second mortgages that include a rehabilitation loan. |
|
APPENDIX E - GLOSSARY
Section titled “APPENDIX E - GLOSSARY”The following definitions are for commonly used terms in the housing element:
Above Moderate-Income: Above moderate-income households are defined as households with incomes over 120 percent of the county median.
Affordability Covenant: A property title agreement that places resale or rental restrictions on a housing unit; also known as a deed restriction.
Affordable Housing: The relationship between the price of housing in a region (either sale price or rent) and household income. Under State and federal statutes, housing that costs no more than 30 percent of gross household income, with some variations, is considered to be affordable housing. Housing costs include rent or mortgage payments, taxes, utilities, solid waste and recycling fees, insurance, homeowner association fees, and related costs.
Assisted Housing: A unit that rents or sells for less than the prevailing market rate due to governmental monetary intervention or contribution. The terms ‘assisted’ and ‘subsidized’ are often used interchangeably.
At-Risk Housing: Applies to existing subsidized affordable rental housing units, especially federally subsidized developments, that are threatened with conversion to market rents because of termination of use restrictions, due to expiration or non-renewal of subsidy arrangements.
Below Market Rate (BMR) Unit: A housing unit that sells or rents for less than the going market rate. It is typically used in reference to housing units that are directly or indirectly subsidized or have other restrictions in order to make them affordable to very low-, low-, or moderate-income households.
By-Right: The City’s review of the owner-occupied or multifamily residential use may not require a conditional use permit, planned unit development permit, or other discretionary local government review or approval that would constitute a ‘project’ for purposes of Division 13 (commencing with Section 21000) of the Public Resources Code. Any subdivision of the sites shall be subject to all laws, including, but not limited to, the City’s ordinance implementing the Subdivision Map Act. A City ordinance may provide that ‘use by right’ does not exempt the use from design review. However, that design review shall not constitute a ‘project’ for purposes of Division 13 (commencing with Section 21000) of the Public Resources Code.
Community Development Block Grant (CDBG): The State CDBG program was established by the federal Housing and Community Development Act of 1974, as amended (42 USC 5301, et seq.). The primary federal objective of the CDBG program is the development of viable urban communities by providing decent housing and a suitable living environment and by expanding economic opportunities, principally for persons of low and moderate income. “Persons of low and moderate income,” or the “targeted income group” (TIG), are defined as families, households, and individuals whose incomes do not exceed 80 percent of the county median income, with adjustments for family or household size.
Condominium: A building or group of buildings in which units are owned individually, but the structure, common areas, and facilities are owned by all owners on a proportional, undivided basis.
Continuum of Care: An approach that helps communities plan for and provide a full range of emergency, transitional, and permanent housing and service resources to address the various needs of homeless persons at the point in time that they need them. The approach is based on the understanding that homelessness is not caused merely by a lack of shelter, but involves a variety of underlying, unmet needs – physical, economic, and social. Designed to encourage localities to develop a coordinated and comprehensive long-term approach to homelessness, the Continuum of Care consolidates the planning, application, and reporting documents for the US Department of Housing and Urban Development’s Shelter Plus Care, Section 8 Moderate Rehabilitation Single-Room Occupancy Dwellings (SRO) Program, and Supportive Housing Program (US House Bill 2163).
Cost Burden: A household has a “housing cost burden” if it spends 30 percent or more of its income on housing costs. A household has a “severe housing cost burden” if it spends 50 percent or more of its income on housing. Owner housing costs consist of payments for mortgages, deeds of trust, contracts to purchase, or similar debts on the property; real estate taxes; fire, hazard, and flood insurance on the property; utilities; and fuels. Where applicable, owner costs also include monthly condominium fees. Renter calculations use gross rent, which is the contract rent plus the estimated average monthly cost of utilities (electricity, gas, water, and sewer) and fuels (oil, coal, kerosene, wood, etc.) if these are paid by the renter (or paid for the renter by someone else). Household income is the total pre-tax income of the householder and all other individuals at least 15 years old in the household. In all estimates of housing cost burdens, owners and renters for whom housing cost-to-income was not computed are excluded from the calculations.
Decennial Census: Every ten years, the Census Bureau conducts a national household survey, producing the richest source of nationally available small-area data. Article I of the Constitution requires that a census be taken every ten years for the purpose of reapportioning the US House of Representatives. The federal government uses decennial census data for apportioning congressional seats, for identifying distressed areas, and for many other activities. Census data is collected using two survey forms: the short form and the long form. Short form information is collected on every person and includes basic characteristics, such as age, sex, and race. The long form is sent to one out of every six households and collects more detailed information, such as income, housing characteristics, and employment. Most of the indicators in DataPlace are from the long form and are thus estimates based on the sample of households. These values may differ considerably from the same indicators based on the short form data, particularly for small areas.
Density: The number of housing units on a unit of land (e.g., 10 units per acre).
Density Bonus Programs: Allows minimum density increase over the zoned maximum density of a proposed residential development, if the developer makes a specified amount of units affordable to lower-income households.
Development Impact Fees: A fee or charge imposed on developers to pay for a jurisdiction’s costs of providing services to new development.
Development Right: The right granted to a landowner or other authorized party to improve a property. Such right is usually expressed in terms of a use and intensity allowed under existing zoning regulation.
Disability: As used in Appendix A, Needs Assessment, the 2020 American Community Survey (ACS) and Puerto Rico Community Survey 2020 Subject Definitions, are used. Disability is defined as the product of interactions among individuals’ bodies; their physical, emotional, and mental health; and the physical and social environment in which they live, work, or play. Disability exists where this interaction results in limitations of activities and restrictions to full participation at school, at work, at home, or in the community. Disability is a dynamic concept that changes over time as one’s health improves or declines, as technology advances, and as social structures adapt. ACS questionnaires cover six disability types:
-
Hearing difficulty: deaf or having serious difficulty hearing (DEAR).
-
Vision difficulty: blind or having serious difficulty seeing, even when wearing glasses (DEYE).
-
Cognitive difficulty: Because of a physical, mental, or emotional problem, having difficulty remembering, concentrating, or making decisions (DREM).
-
Ambulatory difficulty: Having serious difficulty walking or climbing stairs (DPHY).
-
Self-care difficulty: Having difficulty bathing or dressing (DDRS).
-
Independent living difficulty: Because of a physical, mental, or emotional problem, having difficulty doing errands alone such as visiting a doctor’s office or shopping (DOUT).
Respondents who report anyone of the six disability types are considered to have a disability. Further details can be found in these documents: How Disability Data are Collected from The American Community Survey (census.gov) and American Community Survey and Puerto Rico Community Survey 2020 Subject Definitions (census.gov).
Down Payment Assistance: The most popular loans for these programs are with the Federal Housing Administration (FHA). The FHA allows 100 percent gift funds for a down payment and some allowable closing costs. The gift can be from any relative or can be collected through charitable organizations like Neighborhood Gold/The Buyer Fund. Another popular tactic, which can be used in a broader range of loan programs, is to borrow from a 401K. A withdrawal can be made without a penalty and paid back over a specified period.
Dwelling Unit: Any residential structure, whether or not attached to real property, including condominium and cooperative units and mobile or manufactured homes. Includes both one-to-four-family and multifamily structures. Vacation or second homes and rental properties are also included.
Elderly Units: Specific units in a development restricted to residents over a certain age (as young as 55 years and over). Persons with disabilities may share certain developments with the elderly.
Element: A division or chapter of the general plan, master plan, or comprehensive plan.
Emergency Shelter: A facility designed to provide free temporary housing on a night-by-night basis to homeless families and individuals.
Emergency Shelter Grants (ESG): A grant program administered by the US Department of Housing and Urban Development (HUD) provided on a formula basis to large entitlement jurisdictions.
Extremely Low-Income Limit: The upper limit for the extremely low-income category, set at 30 percent of the HUD area median family income. This is not an official program eligibility income limit, except when associated with a specific family size (e.g., “single person,” “family of two,” “family of three,” etc.).
Fair Market Rent (FMR): Freely set rental rates defined by HUD as the median gross rents charged for available standard units in a county or Standard Metropolitan Statistical Area (SMSA). Fair Market Rents are used for the Section 8 Housing Choice Voucher Program and other HUD programs and are published annually by HUD.
Family Income: In decennial census data, family income includes the incomes of all household members 15 years old and over related to the householder. Although the family income statistics from each census cover the preceding calendar year, the characteristics of individuals and the composition of families refer to the time of enumeration (April 1 of the respective census years). Thus, the income of the family does not include amounts received by individuals who were members of the family during all or part of the calendar year prior to the census if these individuals no longer resided with the family at the time of census enumeration. Similarly, income amounts reported by individuals who did not reside with the family during the calendar year prior to the census but who were members of the family at the time of enumeration are included. However, the composition of most families was the same during the preceding calendar year as at the time of enumeration.
Farm Labor Housing (Farmworker): Units for migrant farmworkers that can be available for transitional housing for the homeless when not occupied by migrant farmworkers.
FHA-Insured: The Federal Housing Administration-insured mortgages so that lower- and moderate-income people can obtain financing for homeownership.
First-Time Homebuyer: A first-time homebuyer program provides low-income first-time homebuyers down-payment assistance in the form of a second mortgage loan to serve as “gap financing.” These loans can be up to $40,000, depending on the amount of assistance required by the individual homebuyer.
General Plan: A legal document, adopted by the legislative body of a city or county, setting forth policies regarding long-term development.
Group Quarters: A facility which houses groups of unrelated persons not living in households such as dormitories, institutions, and prisons.
Habitable (room): A space in a structure for living, sleeping, eating, or cooking. Bathrooms, toilet compartments, closets, storage or utility space, and similar areas are not considered habitable space.
Habitat for Humanity: A nonprofit, ecumenical Christian housing ministry that seeks to eliminate poverty housing and homelessness from the world and to make decent shelter a matter of conscience and action. Through volunteer labor and donations of money and materials, Habitat builds and rehabilitates simple, decent houses with the help of the homeowner (partner) families. Habitat houses are sold to partner families at no profit, financed with affordable, no-interest loans. The homeowners’ monthly mortgage payments are used to build still more Habitat houses.
Hispanic or Latino: In decennial census data, Hispanics or Latinos are those who classify themselves in one of the specific Hispanic or Latino categories listed on the census questionnaire – ’‘Mexican,’’ ’‘Puerto Rican,’’ or ’‘Cuban’’ – as well as those who indicate that they are ’‘other Spanish, Hispanic, or Latino.’’ People who do not identify with one of the specific origins listed on the questionnaire but indicate that they are ’‘other Spanish, Hispanic, or Latino’’ are those whose origins are from Spain, the Spanish-speaking countries of Central or South America, the Dominican Republic, or people identifying themselves generally as Spanish, Spanish-American, Hispanic, Hispano, Latino, and so on. People who are Hispanic or Latino may be of any race. There were two important changes to the Hispanic origin question for Census 2000. First, the sequence of the race and Hispanic origin questions for Census 2000 differs from that in 1990; in 1990, the race question preceded the Hispanic origin question. Second, there was an instruction preceding the Hispanic origin question in 2000 indicating that respondents should answer both the Hispanic origin and the race questions. This instruction was added to give emphasis to the distinct concepts of the Hispanic origin and race questions and to emphasize the need for both pieces of information.
Home Investment Partnership Program (HOME): HOME provides formula grants to states and localities that communities use – often in partnership with local nonprofit groups – to fund a wide range of activities that build, buy, and/or rehabilitate affordable housing for rent or homeownership or provide direct rental assistance to low-income people.
Homeless Person: An individual living outside or in a building not meant for human habitation, or which they have no legal right to occupy, in an emergency shelter, or in a temporary housing program which may include a transitional and supportive housing program if habitation time limits exist. This definition includes substance abusers, mentally ill people, and sex offenders who are homeless (US House Bill 2163).
Household: A household is made up of all persons living in a dwelling unit whether or not they are related by blood, birth, or marriage.
Housing Authority: An organization established under state law to provide housing for low- and moderate-income persons. Commissioners are appointed by the local governing body of the jurisdiction in which they operate. Many housing authorities own their own housing or operate public housing funded by HUD.
Housing Choice Voucher Program: Formerly known as Section 8, a subsidy program funded by the federal government and overseen by the California Department of Housing and Community Development to provide low rents and/or housing payment contributions for very low- and low-income households.
Housing First: means the evidence-based model that uses housing as a tool, rather than a reward, for recovery and that centers on providing or connecting homeless people to permanent housing as quickly as possible. Under the Housing First model, services offered are as needed and requested on a voluntary basis and that do not make housing contingent on participation in services.
HUD: The US Department of Housing and Urban Development is cabinet-level department of the federal government that oversees program and funding for affordable housing laws, development, and federally funded financial assistance.
HUD Area Median Family Income: HUD is required by law to set income limits that determine the eligibility of applicants for HUD’s assisted housing programs. Income limits are calculated annually for metropolitan areas and non-metropolitan counties in the United States. They are based on HUD estimates of median family income, with adjustments for family size. Adjustments are also made for areas that have unusually high or low income to housing cost relationships.
Income Categories: The federal and state governments require that local jurisdictions consider the housing needs of households in various “income categories.” Income categories are determined by the median household income at the local level.
Integration: A condition within the program participants geographic areas of analysis, as guided by the California Department of Housing and Community Development’s AFFH Data Viewer, in which there is not a high concentration of persons of a particular race, color, religion, sex, familial status, national origin, or having a disability or a type of disability in a particular geographic area when compared to a broader geographic area.
Large Family or Household: A household or family with five or more members.
Low-Income Housing: Housing that is made available at prices lower than market rates. These lower prices are achieved through various financial mechanisms employed by state and local government authorities.
Low-Income Housing Tax Credit (LIHTC): An indirect federal subsidy used to finance the development of affordable rental housing for low-income households. The LIHTC program may seem complicated, but many local housing and community development agencies are effectively using these tax credits to increase the supply of affordable housing in their communities.
Low-Income Limit: Low-income households are defined as households with incomes between 50 percent and 80 percent of the area median household income.
Manufactured Home: Housing that is constructed of manufactured components, assembled partly at the site rather than totally at the site. Also referred to as modular housing.
Market-Rate Housing: Housing that is not built or maintained with the help of government subsidy. The prices of market-rate homes are determined by the market and are subject to the laws of supply and demand.
McKinney-Vento Act: The primary federal response targeted to assisting homeless individuals and families. The scope of the act includes outreach, emergency food and shelter, transitional and permanent housing, primary health care services, mental health, alcohol and drug abuse treatment, education, job training, and child care. There are nine titles under the McKinney-Vento Act that are administered by several different federal agencies, including HUD. McKinney-Vento Act programs administered by HUD include the Emergency Shelter Grant Program Supportive Housing Program, Section 8 Moderate Rehabilitation for Single-Room Occupancy Dwellings, Supplemental Assistance to Facilities to Assist the Homeless, and Single Family Property Disposition Initiative (US House Bill 2163).
Median Income: Each year, the federal government calculates the median income for communities across the country to use as guidelines for federal housing programs. Area median incomes are set according to family size.
Mental Illness: A serious and persistent mental or emotional impairment that significantly limits a person’s ability to live independently.
Mixed Use: Refers to different types of development (e.g., residential, retail, office) occurring on the same lot or in close proximity to each other. Cities and counties sometimes allow mixed use in commercial zones, with housing typically located above primary commercial uses on the premises.
Mobile Home: A type of manufactured housing. A structure movable in one or more sections, which is at least 8 feet in width and 32 feet in length, is built on a permanent chassis, and is designed to be used as a dwelling unit when connected to the required utilities, either with or without a permanent foundation.
Mobile Home Park: A parcel or tract of land having as its principal use the rental, leasing, or occupancy of space by two or more mobile homes on a permanent or semipermanent basis, including accessory buildings, or uses customarily incidental thereto.
Mobile Home Subdivision: A subdivision of land, platted in conformance to NRS Chapter 278 and applicable city ordinances, for the purpose of providing mobile home lots.
Moderate Income: Moderate-income households are defined as households with incomes between 80 percent and 120 percent of the county median.
Mortgage Credit Certificate Program (MCC): A Federal Income Tax Credit Program. An MCC increases the loan amount an applicant can qualify for and increases an applicant’s take-home pay. The MCC entitles applicants to take a federal income tax credit of 20 percent of the annual interest they pay on their home mortgage. Because the MCC reduces an applicant’s federal income taxes and increases their net earnings, it helps homebuyers qualify for a first home mortgage. The MCC is registered with the IRS, and it continues to decrease federal income taxes each year for as long as an applicant lives in the home.
Mortgage Revenue Bond: A state, county, or city program providing financing for the development of housing through the sale of tax-exempt bonds.
Multifamily Dwelling: A structure containing two or more dwelling units for the use of individual households; an apartment or condominium building is an example of this dwelling unit type.
Non-Hispanic: In decennial census data and in Home Mortgage Disclosure Act data after 2003, non-Hispanics are those who indicate that they are not Spanish/Hispanic/Latino.
Objective Standard: Development, design, and performance standards that involve no personal or subjective judgment by a public official and are uniformly verifiable by reference to an external and uniform benchmark or criterion available and knowable by both the applicant or development proponent and the public official prior to submittal, and includes only such standards as are published and adopted by ordinance or resolution by a local jurisdiction before submission of a development application.
Permanent Housing: Housing which is intended to be the tenant’s home for as long as they choose. In the supportive housing model, services are available to the tenant, but accepting services cannot be required of tenants or in any way impact their tenancy. Tenants of permanent housing sign legal lease documents (US House Bill 2163).
Permanent Supportive Housing: Long-term community-based housing and supportive services for homeless persons with disabilities. The intent of this type of supportive housing is to enable this special needs population to live as independently as possible in a permanent setting. The supportive services may be provided by the organization managing the housing or provided by other public or private service agencies. There is no definite length of stay (US House Bill 2163).
Persons with a Disability: HUD’s Housing Choice Voucher (formerly Section 8) program defines a ‘person with a disability’ as a person who is determined to (1) have a physical, mental, or emotional impairment that is expected to be of continued and indefinite duration, substantially impedes his or her ability to live independently, and is of such a nature that the ability could be improved by more suitable housing conditions; or (2) have a developmental disability, as defined in the Developmental Disabilities Assistance and Bill of Rights Act (US House Bill 2163).
Project-Based Rental Assistance: Rental assistance provided for a project, not for a specific tenant. A tenant receiving project-based rental assistance gives up the right to that assistance upon moving from the project.
Public Housing: The US Department of Housing and Urban Development (HUD) administers federal aid to local housing agencies that manage the housing for low-income residents at rents they can afford. HUD furnishes technical and professional assistance in planning, developing, and managing these developments. It provides decent and safe rental housing for eligible low-income families, the elderly, and persons with disabilities. Public housing can be in the form of high-rise apartments or scattered-site single-family homes.
Rehabilitation: The upgrading of a building previously in a dilapidated or substandard condition for human habitation.
Rental Assistance: A rental subsidy for eligible low- and very low-income tenants. This assistance provides the share of the monthly rent that exceeds 30 percent of the tenants’ adjusted monthly income.
Rent-to-Own: A development financed so that at a certain point in time, the rental units are available for purchase based on certain restrictions and qualifications.
Rural Housing Service (RHA): A part of the US Department of Agriculture’s Rural Development. The RHA offers financial aid to low-income residents of rural areas.
Section 8: Now known as the Housing Choice Voucher Program, a subsidy program funded by the federal government and overseen by the California Department of Housing and Community Development to provide low rents and/or housing payment contributions for very low- and low-income households.
Segregation: A condition within the program participant’s geographic area of analysis….in which there is a high concentration of persons of a particular race, color, religion, sex, familial status, national origin, or having a disability or a type of disability in a particular geographic area when compared to a broader geographic area.
Service Needs: The particular services required by special populations, typically including needs such as transportation, personal care, housekeeping, counseling, meals, case management, personal emergency response, and other services preventing premature institutionalization and assisting individuals to continue living independently.
Single-Room Occupancy Dwelling (SRO): The SRO program provides rental assistance for homeless persons in connection with the moderate rehabilitation of SRO dwellings. SRO housing contains units for occupancy by one person. These units may contain food preparation or sanitary facilities, or both.
Special Needs Projects: Housing for a designated group of people who desire special accommodations, such as services, in addition to housing. Services may or may not be provided as part of the rental project. Examples of special needs populations are people with physical disabilities, developmental disabilities, mental illness, or those who need assisted living. It also includes health care facilities.
Subsidized Housing: Typically refers to housing that rents for less than the market rate due to a direct financial contribution from the government. There are two general types of housing subsidies. The first is most commonly referred to as ‘project-based’ where the subsidy is linked with a particular unit or development, and the other is known as ‘tenant-based’ where the subsidy is linked to the low-income individual or family. The terms ‘assisted’ and ‘subsidized’ are often used interchangeably.
Substandard Housing: Housing where major repair or replacement may be needed to make it structurally sound, weatherproofed, and habitable.
Supportive Housing: Housing with no limit on length of stay, that is occupied by the target population, and that is linked to an on- or off-site service that assists the supportive housing resident in retaining the housing, improving his or her health status, and maximizing his or her ability to live and, when possible, work in the community.
Supportive Services: Services provided to residents of supportive housing for the purpose of facilitating the independence of residents. Some examples are case management, medical or psychological counseling and supervision, child care, transportation, and job training.
Target Population: Persons with low incomes who have one or more disabilities, including mental illness, HIV or AIDS, substance abuse, or other chronic health condition, or individuals eligible for services provided pursuant to the Lanterman Developmental Disabilities Services Act (Division 4.5 (commencing with Section 4500) of the Welfare and Institutions Code) and may include, among other populations, adults, emancipated minors, families with children, elderly persons, young adults aging out of the foster care system, individuals exiting from institutional settings, veterans, and homeless people.
Transitional Housing: Buildings configured as rental housing developments, but operated under program requirements that require the termination of assistance and recirculating of the assisted unit to another eligible program recipient at a predetermined future point in time that is no less than six months from the beginning of the assistance.
VA-Guaranteed: Loans made by private lenders to eligible veterans for the purchase of a home which must be for their own personal occupancy. To get a loan, a veteran must apply to a lender. If the loan is approved, the VA will guarantee a portion of it to the lender. This guaranty protects the lender against loss up to the amount guaranteed and allows a veteran to obtain favorable financing terms.
Very Low-Income Limit: Very low-income households are defined as households with incomes less than 50 percent of the area median household income.
Veteran: Anyone who has been discharged from the military generally after at least two years of service whether they served on active duty in a conflict or not (US House Bill 2163).
Workforce Housing: Housing that is affordable to households earning between 60 and 120 percent of area median income (AMI). Workforce housing targets middle-income families and workers including teachers, health care workers, retail clerks, young professionals, and more.
Zoning: An activity undertaken by local jurisdictions to direct and shape land development activities. The intent of zoning is to protect the public health, safety, and welfare by ensuring that incompatible land uses (e.g., residential vs. heavy industrial) are not located next to each other. Zoning also impacts land values, creating and taking away “capital” for and from property owners. For example, a lot that is zoned for commercial development is more valuable (in financial terms) than a lot that is zoned for open space. Typically, lots that are zoned for higher densities have greater value on the market than lots that are zoned for lower densities. Zoning is one of the most important regulatory functions performed by local jurisdictions.
US CENSUS TERMS
Section titled “US CENSUS TERMS”Children: The term ‘children,’ as used in tables on living arrangements of children under 18, includes all persons under 18 years, excluding people who maintain households, families, or subfamilies as a reference person or spouse.
Own Children: Sons and daughters, including stepchildren and adopted children, of the householder. Similarly, ‘own’ children in a subfamily are sons and daughters of the married couple or parent in the subfamily. (All children shown as members of related subfamilies are own children of the person(s) maintaining the subfamily.) For each type of family unit identified in the CPS, the count of ‘own children under 18 year old’ is limited to never-married children; however, ‘own children under 25’ and ‘own children of any age,’ as the terms are used, include all children regardless of marital status. The counts include never-married children living away from home in college dormitories.
Related Children: Includes all people in a household under the age of 18, regardless of marital status, who are related to the householder. It does not include householder’s spouse or foster children, regardless of age.
Ethnic Origin: People of Hispanic origin were identified by a question that asked for self-identification of the persons’ origin or descent. Respondents were asked to select their origin (and the origin of other household members) from a ‘flash card’ listing ethnic origins. People of Hispanic origin, in particular, were those who indicated that their origin was Mexican, Puerto Rican, Cuban, Central or South American, or some other Hispanic origin. It should be noted that people of Hispanic origin may be of any race.
Family: A group of two or more people who reside together and who are related by birth, marriage, or adoption.
Family Household (Family): A family includes a householder and one or more people living in the same household who are related to the householder by birth, marriage, or adoption. All people in a household who are related to the householder are regarded as members of his or her family. A family household may contain people not related to the householder, but those people are not included as part of the householder’s family in census tabulations. Thus, the number of family households is equal to the number of families, but family households may include more members than do families. A household can contain only one family for purposes of census tabulations. Not all households contain families since a household may comprise a group of unrelated people or one person living alone.
Family Size: Refers to the number of people in a family.
Family Type: Refers to how the members of a family are related to one another and the householder. Families may be a “Married Couple Family,” “Single Parent Family,” “Stepfamily,” or “Subfamily.”
Household: Includes all the people who occupy a housing unit as their usual place of residence.
Household Income: The total income of all the persons living in a household. A household is usually described as very low income, low income, moderate income, and above moderate income based on household size and income, relative to regional median income.
Household Size: The total number of people living in a housing unit.
Household Type and Relationship: Households are classified by type according to the sex of the householder and the presence of relatives. Examples include married-couple family; male householder, no wife present; female householder, no husband present; spouse (husband/wife); child; and other relatives.
Householder: The person, or one of the people, in whose name the home is owned, being bought, or rented. If there is no such person present, any household member 15 years old and over can serve as the householder for the purposes of the census. Two types of householders are distinguished: a family householder and a non-family householder. A family householder is a householder living with one or more people related to him or her by birth, marriage, or adoption. The householder and all people in the household related to him are family members. A non-family householder is a householder living alone or with non-relatives only.
Housing Unit: A house, an apartment, a mobile home or trailer, a group of rooms, or a single room occupied as separate living quarters, or if vacant, intended for occupancy as separate living quarters. Separate living quarters are those in which the occupants live separately from any other individuals in the building and which have direct access from outside the building or through a common hall. For vacant units, the criteria of separateness and direct access are applied to the intended occupants whenever possible.
Median: This measure represents the middle value (if n is odd) or the average of the two middle values (if n is even) in an ordered list of data values. The median divides the total frequency distribution into two equal parts: one-half of the cases fall below the median and one-half of the cases exceed the median.
Median Age: This measure divides the age distribution in a stated area into two equal parts: one-half of the population falling below the median value and one-half above the median value.
Median Income: The median income divides the income distribution into two equal groups; one has incomes above the median and the other having incomes below the median.
Occupied Housing Unit: A housing unit is classified as occupied if it is the usual place of residence of the person or group of people living in it at the time of enumeration, or if the occupants are only temporarily absent; that is, away on vacation or a business trip. The occupants may be a single family, one person living alone, two or more families living together, or any other group of related or unrelated people who share living quarters.
Overcrowded Units: Occupied housing units that have more than 1 person per room.
Per Capita Income: Average obtained by dividing aggregate income by total population of an area.
Population Estimate (Population Estimates Program): The Census Bureau’s Population Estimates Program (PEP) produces July 1 estimates for years after the last published decennial census, as well as for past decades. Existing data series such as births, deaths, federal tax returns, Medicare enrollment, and immigration are used to update the decennial census base counts. POP estimates are used in federal funding allocations, in setting the levels of national surveys, and in monitoring recent demographic changes.
Population Projections: Estimates of the population for future dates. They illustrate plausible courses of future population change based on assumptions about future births, deaths, international migration, and domestic migration. Projections are based on an estimated population consistent with the most recent decennial census as enumerated. While projections and estimates may appear similar, there are some distinct differences between the two measures. Estimates usually are for the past, while projections typically are for future dates. Estimates generally use existing data, while projections must assume what demographic trends will be in the future.
Poverty: Following the Office of Management and Budget’s (OMB’s) Directive 14, the Census Bureau uses a set of money income thresholds that vary by family size and composition to detect who is poor. If the total income for a family or unrelated individual falls below the relevant poverty threshold, then the family or unrelated individual is classified as being “below the poverty level.”
Poverty Rate: The percentage of people (or families) who are below poverty.
Race: The race of individuals was identified by a question that asked for self-identification of the person’s race. Respondents were asked to select their race from a ‘flashcard’ listing racial groups.
Severely Overcrowded: Occupied housing units with 1.51 or more persons per room.
Single-Family Attached Housing: A one-unit residential structure that has one or more walls extending from ground to roof separating it from adjoining structures. This category includes row houses, townhouses, and houses attached to nonresidential structures.
Single-Family Detached Homes: A one-unit residential structure detached from any other house (i.e., with open space on all four sides). A house is considered detached even if it has an adjoining shed or garage.
Tenure: The distinction between owner-occupied and renter-occupied housing units. A housing unit is ‘owned’ if the owner or co-owner lives in the unit, even if it is mortgaged or not fully paid for. A cooperative or condominium unit is ‘owned’ only if the owner or co-owner lives in it. All other occupied units are classified as ‘rented,’ including units rented for cash rent and those occupied without payment of cash rent.
Two-Family Buildings: These dwellings may also be referred to as single-family attached because a duplex with a shared wall would qualify in both categories. Other two-family buildings would include older single-family homes that have been converted into two separate living spaces or ‘flats’ that do not share walls, but do share a floor/ceiling.
Unemployed: All civilians 16 years old and over are classified as unemployed if they (1) were neither “at work” nor “with a job but not at work” during the reference week, and (2) were actively looking for work during the last four weeks, and (3) were available to accept a job. Also included as unemployed are civilians who did not work at all during the reference week, were waiting to be called back to a job from which they had been laid off, and were available for work except for temporary illness.
Unemployment Rate: The proportion of the civilian labor force that is unemployed, expressed as a percentage.
Units in Structure: A structure is a separate building that either has open spaces on all sides or is separated from other structures by dividing walls that extend from ground to roof. In determining the number of units in a structure, all housing units, both occupied and vacant, are counted.
Vacancy Rate: The housing vacancy rate is the proportion of the housing inventory that is available ’‘for sale’’ or ’‘for rent.’’ It is computed by dividing the number of available units by the sum of occupied units and available units, and then multiplying by 100.
Vacant Housing Unit: A housing unit is vacant if no one is living in it at the time of enumeration, unless its occupants are only temporarily absent. Units temporarily occupied at the time of enumeration entirely by people who have a usual residence elsewhere are also classified as vacant. New units not yet occupied are classified as vacant housing units if construction has reached a point where all exterior windows and doors are installed and final usable floors are in place. Vacant units are excluded from the housing inventory if they are open to the elements; that is, the roof, walls, windows, and/or doors no longer protect the interior from the elements. Also excluded are vacant units with a sign that they are condemned or they are to be demolished.
White: In decennial census data, the White category includes persons having origins in any of the original peoples of Europe, the Middle East, or North Africa. It includes people who indicate their race as ’‘White’’ or report entries such as Irish, German, Italian, Lebanese, Near Easterner, Arab, or Polish. The “alone” designation, as used with decennial census data, indicates that the person reported only one race.
Year Structure (housing unit) Built: Refers to when the building was first constructed, not when it was remodeled, added to, or converted. The data relate to the number of units built during the specified periods that were still in existence at the time of enumeration.
APPENDIX F - STAKEHOLDER INTERVIEWS
Section titled “APPENDIX F - STAKEHOLDER INTERVIEWS”The City of Yreka interviewed representatives of organizations of the following types:
Profession/Business
Section titled “Profession/Business”- Realtor
- Realtor
- Developer/Rural Communities Housing Development Corporation, a nonprofit affordable housing developer
- Homeless Advocate/Youth Advocate/Youth Empowerment Siskiyou
- Realtor/Property Manager
- Business Owner/Property Manager
- Property Manager/Housing Financer/Tardie Investments
- Property Manager/Landlord/Budget Inn Owner
- Property Manager/Business Owner
- Siskiyou Escrow Services
- Business Owner/Gold Nugget Printing
- Developer/Jefferson Inn/Mountain View Motel
- Youth Advocate/Siskiyou Family YMCA
- Engineer/Developer
Stakeholder Interview Questions
Section titled “Stakeholder Interview Questions”Introduction
Section titled “Introduction”The City of Yreka has started working on its 6th Cycle Housing Element. This document is part of the City’s General Plan and is intended to help guide equitable housing development within the City over the next eight years. Unlike other elements of the City’s General Plan, the Housing Element has to identify specific factors related to housing and is subject to review and approval by the California Department of Housing and Community Development also known as HCD.
Since the last time the Housing Element was updated, over a dozen new housing laws have been passed related to the creation of affordable housing. The current update must take into consideration all these new laws in addition to following the general guidelines for Housing Elements. Major components of the document include a housing needs assessment, identification of potential sites for housing at all income levels, a review of obstacles to the creation of housing, and updated policies and programs that the City can use to carry out the goals of the element.
Currently, we are working on gathering stakeholder and community input on housing needs in the city. By engaging with a broad spectrum of people from the community, we are hoping to identify the main barriers individuals and families face when attempting to find housing and also what people think is most important when looking for a home. This could include proximity to grocery shopping, schools, medical services, and transportation or other important factors such as number of bedrooms, perceived safety, access to parks, and other amenities.
We appreciate the time you are taking to provide this valuable input. The policies and programs developed through this process will help guide decision makers for years to come so it is important to make sure we know what the community needs. In the end, the General Plan and its many elements are in place to help create a community that you feel at home in and are happy to be a part of.
Participant #1
Section titled “Participant #1”-
What are the top three issues you come across when help those seeking out housing or building housing?
- No developers/development in the area
- Lack of housing
-
What should the City’s priorities be when addressing housing needs for the community?
- Providing incentives to builders/developers to attract them to come to our area
- Lessen permit fees
- Offer assistance
- Market the city to developers
- Recruit people to come here
- Talk w/ the RV parks in town and find out how many permanent units are there
- Providing incentives to builders/developers to attract them to come to our area
-
What do you feel are the greatest challenges to finding or developing housing in the City?
- Cost
- Availability
-
What types of housing do you think would be most beneficial for the community? (e.g. fourplexes, apartments, townhomes, tiny home/ cottage developments, or others?)
- More apartments/fourplexes
- Multifamily uses
- Lower income
-
Are there any developments within the City that you think are good examples of the types of housing we need?
- No I don’t see any development that is existing that we need
-
Are there certain areas in the City you think could benefit from revitalization as housing or mixed use developments?
- Look at san jose, santa clara, commercial and residential mixed use, everything is right there, easy to acces.
- Don’t separate commercial from residential
-
Are there any major housing development projects in the region that we should know about or that you think are innovative examples the City could follow?
- Nothing in siskiyou county, medford is doing a few apartment complexes and newer development
-
Do you think that recent events, including Covid-19, wildfires, and climate change, have impacted the ability of people to find and keep housing in Yreka? If yes, how?
- Cost of home/business insurance has increased, cost of living has increased, people are unable to afford everything at once
- New updates and mandates happen overnight and hard for people to keep up with
- Need a better plan in place during emergencies
- Hard for people to start businesses and find homes/build homes when the rules keep changing and there’s no help/support/assistance
-
What do you think are the best ways to engage disadvantaged groups in the community?
- Go to low income housing and meet people where they are because they won’t come to you
- Incentivize?
- Meet w/ business owners/managers
- Go to low income housing and meet people where they are because they won’t come to you
-
Are there any other matters related to housing that you would like to share?
- Its important to business owners that they have employees with reliable housing in Yreka because it’s more of a guarantee people will work if they are closer to their employer
Participant #2
Section titled “Participant #2”-
What are the top three issues you come across when help those seeking out housing or building housing?
- Availability of units/access
- Small mobile homes owned by management and rented out (always full)
- Income and cost of living
- Availability of units/access
-
What should the City’s priorities be when addressing housing needs for the community?
- Provide subsidies for low income tenents that wouldn’t otherwise qualify
- Work with community and parks to get people into units and off the streets
-
What do you feel are the greatest challenges to finding or developing housing in the City?
- Getting people to purchase their own units
- Getting assistance from other agencies
-
What types of housing do you think would be most beneficial for the community? (e.g. fourplexes, apartments, townhomes, tiny home/ cottage developments, or others?)
- RVs/mobile home parks/tiny home parks
- Small but fast to get into and more affordable
- Park operators/managers keep parks clean and under supervision and sets standards
- Apartments are good but costly and take time to develop and even more time to apply and get in/off wait list
- RVs/mobile home parks/tiny home parks
-
Are there any developments within the City that you think are good examples of the types of housing we need?
- No opinion
-
Are there certain areas in the City you think could benefit from revitalization as housing or mixed use developments?
- Mixed use as much as possible to allow new development and promote business growth without limiting housing space
-
Are there any major housing development projects in the region that we should know about or that you think are innovative examples the City could follow?
- No opinion
-
Do you think that recent events, including Covid-19, wildfires, and climate change, have impacted the ability of people to find and keep housing in Yreka? If yes, how?
- Yes, saw fewer people being delinquent on their bills during covid because of lower prices to start
- Potential applicants turned away if there was work gaps or no proof of income
-
What do you think are the best ways to engage disadvantaged groups in the community?
- Find resources they are already using and meet them there (i.e. schools, behavioral health, resource centers, etc.)
- Fliers/paper newsletters (older folks and lower income individuals don’t use or don’t have access to computers/internet)
-
Are there any other matters related to housing that you would like to share?
- RV parks are a great way to get a lot of people in to units quickly and affordably
- Animals are allowed and there is a higher cap on amount of individuals allowed in one unit
- Maybe the city can work with individuals who don’t have work history (teens, those out of work looking for work) to help get them into units they otherwise wouldn’t be qualified for
Participant #3
Section titled “Participant #3”-
What are the top three issues you come across when help those seeking out housing or building housing?
As a newer developer of housing, I find the process unclear for newer people. Unless you are an experienced developer, you are unaware of what grants, permits, and financing is needed to develop housing. The cost to a developer is high just to get initial engineering ($5k to $10k). Then a developer must go through a 6-to-12-month process for approval. The labor and contractors then are a year out. A 2-to-3-unit house is a 2 to 3 year process with no return on investment during that time when you are paying property taxes, rent, etc. The median income is subpar which leads people to think that rents are high. Rents are not high in my opinion so how can we raise the median income. I would like to see a minimum wage of $20 to $25 an hour for city employees and county workers to be able to afford more. To rent to Section 8, a developer or manager only gets $611 when a market rate 1-bedroom goes for $850 a month. In my opinion 40% or more of renters are paying more than 30% of their income on rent. Additionally, there is no housing for medical staff, as a pharmacist I see many people including myself commute from Ashland. Why is that? I don’t believe we have housing good enough for them and we don’t have the amenities. Plus, these people are not spending their money in Yreka which means we are losing money from our economy.
-
What should the City’s priorities be when addressing housing needs for the community?
Increase wages and incentive people to live in Yreka. People who live farther away pay more in gas, pollute more, and have less time to spend on themselves and their families. People who living in the city should get a $200 a month bonus to incentive them to stay here and move here. Housing and homelessness are not as big of a problem in other cities because Yreka has the resources that attract them. Homelessness disincentivizes more affluent people moving here because they do not like the look of the city. The city should create an income tax and tax bigger businesses to get more revenue to address the homeless issue and encourage people to live here by giving residents tax rebates that must be spent in the local economy.
-
What do you feel are the greatest challenges to finding or developing housing in the City?
Labor force. There are not enough contractors, roofers, and plumbers, etc. The ones that are here charge too much and do not do good work because there is no competition. We need more competition to get better service and shorter wait times for developers. We need to improve the contractor pool. We lack medical services and private practices to care for our residents. Yreka has to grow out of this ‘small town’ mindset. It hasn’t worked I the past and we need growth to have nicer amenities and more tax revenues. We need to expand outside regional and national businesses to encourage more affluent residents to live here. We also need anchor institutions like a Safeway and entertainment to support the population. We need to ask ourselves why the City of Yreka is not 10,000 plus population already and address those issues.
-
What types of housing do you think would be most beneficial for the community? (e.g. fourplexes, apartments, townhomes, tiny home/ cottage developments, or others?)
For the best value for a developer: single family homes. Anything will work for individuals. We need more 50 plus unit apartments to generate long-term revenue. The smaller unit apartments are harder to manage and keep in good condition due to economies of scale. The transitional housing is hard to keep up because it is so subsidized by grant dollars. We need to help new, smaller scale developers understand process, grants, and financing for projects. I would like to see the city host quarterly developer meetings to educate people on the process. Those that show promise should get one-on-one time and consultation with the city to see a project through. The quarterly meetings can be about where are the grants? What is the process? And financing options. This could also filter real applicants.
-
Are there any developments within the City that you think are good examples of the types of housing we need?
Cannot thin of anything. There is nothing available for rent or won that is nicer. Wants more higher end housing. Higher end will attract nicer community members. The focus on low income is too high. Newer units with a nice view of Mt. Shasta would gain the City more tax revenue and balance the income levels of the City.
-
Are there certain areas in the City you think could benefit from revitalization as housing or mixed use developments?
Main street; vacant Shopko building, vacant commercial buildings; old Sears building; Bruce Street trailer park needs to go and be improved into nicer housing. Highway 3 project will only beautify the road and not the adjacent parcels. Where is a wine and in place in Yreka. We need to improve the adjacent properties into mixed use housing and nicer amenities.
-
Are there any major housing development projects in the region that we should know about or that you think are innovative examples the City could follow?
Oregon program to convert hotels into apartments; Super 8 in town would be a great location with the amenities and parking area. Jefferson Inn would be a good conversion project. There needs to be a variety of scales for hotel/motel conversions. An RV program for homeless to live in RVs at the trailer park part time. Behavioral Health area is unsafe and should be addressed. The Tesla charging stations at Walmart are also unsafe with homeless camping there.
-
Do you think that recent events, including Covid-19, wildfires, and climate change, have impacted the ability of people to find and keep housing in Yreka? If yes, how?
COVID no. The wildfires in Hornbrook and Happy Camp did impact the number of people that move to escape the fire and put pressure on the housing market. What resources can Yreka give to these smaller places to prevent them from burning down and to house more people. We need to have the city collaborate more with the county and other cities on the housing and homeless issue.
-
What do you think are the best ways to engage disadvantaged groups in the community?
No outreach. There should be stricter enforcement of the law and these people should not be allowed to liver wherever they want. They have a negative image on the City and convince people not to live and visit here. Not engagement, enforcement.
-
Are there any other matters related to housing that you would like to share?
There needs to be a county wide housing collaborative. The county needs a group to focus on the homeless issue and make clear enforceable goals for the next 5, 10, and 20 years. Need to look long-term to address the issue. The City needs a housing specific person and department to do all of these things in the city. Invest in a person to focus solely on housing.
Participant #4
Section titled “Participant #4”-
What are the top three issues you come across when helping those seeking out housing or building housing?
We have more demand than supply. There is a backlog of buyers. The pandemic has created a bigger issue due to the ability to work remotely and that is the biggest influence in the last year. The lack of supply and the high demand has made the price of housing increase that does not allow people willing to sell the ability to sell. Low amount of inventory is typical of the state and the nation. It is a lovely place to live and now you don’t need to work here to live here. There is less and less building for the last ten years. This is a combination of developable lots and the changes in the California Building Code requirements. The new codes allow for easier to remodel than to build new. To follow all the new codes and pay all the fees required, the developers are wary to build. If we had a contractor that did two or three homes, then we are good but no large scale development. Would like to see more incentive for more people to develop. The choice to increase City development fees discourages builders. We would get more development with the reduction in fees. There are no rentals and there is a need for speculative houses and rentals. It is a restrictive market.
-
What should the City’s priorities be when addressing housing needs for the community?
Easing up on the cost to build. More incentives to build more. The tax dollars will be better on the other end. A developed piece of property is better than a vacant piece of property. Property between French and Meadowlark, started as a dense subdivision and changed to a mixture of housing. There was a public outcry to prevent smaller units and mixed housing. The infrastructure was a limiting factor for that area. The building is now a blight. The reasoning is not clear why it is not able to be lived in or rehabilitated. There is no development going on whatsoever. We have children, people, and families that would like to move here but there is nothing available. We don’t have a huge number of undeveloped lots to build.
-
What do you feel are the greatest challenges to finding or developing housing in the City?
Cost to build. There was public outcry for low income subdivision in the Meadowlark due to previous low income developments that resulted in issues with the inhabitants not taking care of the property, higher crime, and issues with people outgrowing the houses. Some of the areas are improved and there is a full circle to returning to a better development. The previous developments were too large to handle and there were people getting homes that were not ready or able to properly take care of their home. There is now a greater benefit to two to three units. There is a need for the level beyond the ‘starter home’ to allow people to move up in the market. It is a catch 22 with the public where you want to see it stay the same and not having more housing to accommodate more people and housing. There was momentum for northern development and annexation to the City and was stopped for some reason.
The timeframe for review of the building permits is perceived as extensive. Being told that in processing plans that the County and City are backlogged and the time to get things approved is long. Dealing with multiple agencies take things longer.
Fire insurance and the hardening process for homes is difficult and complex that people are unable to meet these issues.
-
What types of housing do you think would be most beneficial for the community? (e.g. fourplexes, apartments, townhomes, tiny home/ cottage developments, or others?)
We need everything so it is hard to say. We do need single-family homes. We do need another condo area for something like the PUD on Lane Street. The aging population wants a smaller unit with less maintenance. There needs to be a little bit of everything. I don’t know if tiny homes are appropriate in this town. I think we get caught up in the cost of infrastructure.
There are a lot of apartments already and I don’t think we need more. If you have $3000 or more $4000 then you can buy a house with less monthly payments than renting. We are so far behind meeting the housing needs that we need some sort of progress. Maybe reinviting something for the north side of the city and allow it to move forward. Look at some of the older subdivisions and renew interest in those areas.
I feel people want more space than postage lots. Sierra Vista goes up for sale and the prices are high and difficult to get a unit. It is good that we have people who want to deal with that.
High density is not the type of community Yreka needs.
-
Are there any developments within the City that you think are good examples of the types of housing we need?
Terrace Drive to Northridge with 9 lots. That kind of housing in the 1400 to 1800 sq ft is desirable for the working level person. There hasn’t been anything since that time. The extension of Discovery in to Northview estates is too much in terms of cost and size. The Turre, Lawrence Ln, and Meadowlark 1100 to 1200 sq ft starting homes is great. The area around the hospital could be developed in small bits. 3 or 4 lots at a time. The late 1980s on Terrance.
-
Are there certain areas in the City you think could benefit from revitalization as housing or mixed use developments?
Around the hospital would be great to see. I would like to see something happen there. Out on foothill there could be some redevelopment and investment for mixed use and housing focus. The issue on Foothill is a stormwater concern. Over by Meeks is a good area for development. There is 3 acres on Campbell that could be a three-lot housing development. The sewer would need to be extended under the street on Campbell.
-
Are there any major housing development projects in the region that we should know about or that you think are innovative examples the City could follow?
Redding or Medford. There are a couple of areas north of Mt. Shasta and south of Weed that are popular but very pricey. I don’t think there is much in Siskiyou County that we can look at. Weed tried very hard after the Boyles Fire. I don’t have a lot of knowledge about other areas that are doing well. There is development in Redding, what is allowing them to do that?
-
Do you think that recent events, including Covid-19, wildfires, and climate change, have impacted the ability of people to find and keep housing in Yreka? If yes, how?
Absolutely. There is more pressure toward finding housing in this area for people wanting to get out of traffic in cities. As long as they are on the interstate then they only commute once a month. COVID created that issue. The wildfires have not been helpful to the loss of insurance. Everything is frozen. If you can’t get insurance, then you cannot get a house or financing. There is activity on the state level to ensure fairness and better rating plans. People are living longer and want to live here in between Washington and the rest of California, four seasons, outdoors, and not much to do here. The airport in Medford is a factor for people to live in Yreka. We have safe neighborhoods compared to other areas. Low crime rates are a good factor for Yreka.
-
What do you think are the best ways to engage disadvantaged groups in the community?
Involving the unhoused and low-income people so that we end up working together. The information that we are collecting right now and getting them involved with the information gathering. I get locked up in the fact that some people don’t want to work and get hand-outs from the government which makes the employment world in need. We give a lot out. We need to get people into the conversation of improving their neighborhoods and properties. We live in a really free area and I don’t understand why anyone should feel lesser than anyone else. If you work then you can provide for your family and there are people in the community hat people can talk to and listen to for help. Habitat for Humanity is an asset for this. The faith community supporting people. Everyone deserves a nice place to live. Incorporate leaders in the areas of assisting the unhoused and low income.
-
Are there any other matters related to housing that you would like to share?
Retail diversity is lacking due to Medford providing big retailer.
Positive growth for the community would be seeing construction and more development. If you go to a city and see construction then you think that things are happening. It makes you feel good and things are not just stale. Seeing someone break ground and marketing that would make people feel good. Progress like the new courthouse makes everyone feel uplifted and it is something people have never seen in this town. There is growing and happiness and community.
Participant #5
Section titled “Participant #5”- What are the top three issues you come across when help those seeking out housing or building housing?
- Shortage of single family homes and apartments
- Rent and cost of living have increased
- What should the City’s priorities be when addressing housing needs for the community?
- I don’t see how the city can help residential
- Remove homeless?
- Change definition of land size/minimum lot size to allow smaller lots and possibly more development
- Change setback requirements
- Fit many homes on one parcel
- What do you feel are the greatest challenges to finding or developing housing in the City?
- Not cost effective to build
- No return on investment
- Land is available
- Even cheap homes are still expensive
- Cost of labor/materials/utilities
- What types of housing do you think would be most beneficial for the community? (e.g. fourplexes, apartments, townhomes, tiny home/ cottage developments, or others?)
- A little of everything
- Single family dwellings are nice but no one can afford that
- Have options available for people
- Are there any developments within the City that you think are good examples of the types of housing we need?
-
Smaller cleaner safer version of the camel tracks
- Smaller land size for smaller homes and lots of them
-
RV’s, Mobile Homes, and tiny homes don’t work
- Temp fix to a bigger issue
-
- Are there certain areas in the City you think could benefit from revitalization as housing or mixed use developments?
- Zoning doesn’t matter
- Too many commercial lots vacant
- Everything needs to be mixed use
- Are there any major housing development projects in the region that we should know about or that you think are innovative examples the City could follow?
- Nothing I can think of
- Do you think that recent events, including Covid-19, wildfires, and climate change, have impacted the ability of people to find and keep housing in Yreka? If yes, how?
- Not in Siskiyou County
- What do you think are the best ways to engage disadvantaged groups in the community?
- Good luck, I don’t know
- Once people are where they are they don’t want to move
- Are there any other matters related to housing that you would like to share?
- I was born and raised in Yreka and the homeless issue is outrageous/disappointing
- Trash everywhere
- Unsafe
- Deters tourists
- I was born and raised in Yreka and the homeless issue is outrageous/disappointing
Participant #6
Section titled “Participant #6”-
What are the top three issues you come across when help those seeking out housing or building housing?
Affordability. The fact that there is no development or housing. The next thing is that people are surprised how far Yreka has gone downhill. People who have previously been here comment on how Yreka looks like it is on its last legs. Aesthetics, homeless. The City looks extremely run down. In the past the houses and yards were beautiful and there is trash everywhere. The housing itself has become a serious issue. The most recent subdivision that had all of the approvals and permitting failed due to the pricing and payments to the City. The developer abandoned the subdivision due to the city fees associated with the utilities and the development impact fees. The cost of building today is astronomically higher than when the subdivision was originally proposed. Feels it is extremely shortsighted of the city to require so many fees. The proposed subdivision had a series of housing types that would have benefited the City. Another subdivision proposal with a golf course and housing was abandoned due to the City vetoing the look of the housing and the proposed development. Difficulty with the Planning Commission on how things looked.
-
What should the City’s priorities be when addressing housing needs for the community?
The City’s priority should be to get developers in here to support the middle class that work here and cannot afford a house. The general population cannot afford to buy a $400,000 house. People who work supportive jobs at the courthouse cannot afford a home and are not interested in renting what is available. The City needs to address contractors and developers so they will come in and build. I would like the city to decrease in population but that is not going to happen. There are great people who want to come here from the cities that would be great additions to the city.
-
What do you feel are the greatest challenges to finding or developing housing in the City?
Above.
-
What types of housing do you think would be most beneficial for the community? (e.g. fourplexes, apartments, townhomes, tiny home/ cottage developments, or others?)
I think single family primarily and then some people do want to put in tiny house and manufactured housing. There should be a focus on families. There is a focus on people wanting old folks housing but there should be more for families. Very few people want to live in apartments. We do need that interim housing but there needs to be a process for people to move up into a single family home. And it needs to be something that they can afford. People around the city are not okay with what the buildings look like. We should not discourage outside builders coming into the city. There has been a previous push for local only builders.
-
Are there any developments within the City that you think are good examples of the types of housing we need?
Lewis when it started was a farm home project just like on Campbell. People actually make the switch where they care about their homes. There are homes in the upper $200,000 in price that are well kept. I love Chris’ subdivision on Discovery but it for people who have a lot of money. I am thinking about the first time home buyers and want them to get a home. The City can be hugely helpful in bringing down the developer fees and seeking developers even outside the area. The City could offer lower interest development loans and helping finance the infrastructure. Work with people to help them find a way to get more housing. People are looking for housing in the $180,000 range. Help people afford homes in that range. People are looking for 3 bedroom and 2 bathrooms for about 1300 sq. ft. The older generation want the 2 bedroom and 2 bathrooms for about 1700 sq. ft. The sq. ft. range is 1400 sq. ft.
-
Are there certain areas in the City you think could benefit from revitalization as housing or mixed use developments?
Fourth Street is one that could be converted back to housing. The commercial development is moving to the outer areas of the town. The Shopsmart is an eye sore and could be redeveloped. I get annoyed when people say Yreka is on its last legs. Yreka is a fabulous town and amazing structure that could be revitalized. The city has the same opportunity as Jacksonville, OR. We need to look at bringing in tourism. We have the government and the college and to get more housing to supply for the workers.
-
Are there any major housing development projects in the region that we should know about or that you think are innovative examples the City could follow? No
-
Do you think that recent events, including Covid-19, wildfires, and climate change, have impacted the ability of people to find and keep housing in Yreka? If yes, how?
The wildfire issues have created an insurance issue. The insurance companies have made it impossible to finance houses. On Little Creek, there is a house in a grove of Oak Streets and people had to back out because the fire insurance is $12,000 a year, not just insurance but just fire insurance. We need to get insurance down.
-
What do you think are the best ways to engage disadvantaged groups in the community?
There is a lot of help with the housing going in on Foothill. There needs to be more senior housing that are on fixed incomes. The issues in the low-income units now are the heating and utilities bills. I am not sure how you reach them. I think there is a lot of parents of children that could be contacted. Children need help that could be focused. I do deal with people who have physical disabilities that just deal with the housing situation. I find that older people are recognizing that they are not going to continue to walk so they need one level. There are family people who don’t need anything special, but they just need a home. Then you have seniors that want a single level and not concrete. There is a home on North Street where there is a deep foundation so the garage is on the same level of the house. We need to bury the foundation and not concrete. I understand that a concrete slab is a great idea but the soils and water of Yreka split the foundation. We need specialized building that answer these questions and issues. We may need to spend more and create less housing to have the special housing needs.
-
Are there any other matters related to housing that you would like to share?
Home ownership is one of the most important things for people and their lives. We don’t have anything in a decent neighborhood in an affordable price range.
People are willing to take subpar housing and poor housing just to get their own home.
Take Miner Street and get rid of the cars. We could make the downtown so much more if we cobblestone it and get people in there. The idea of second story apartments in the historic downtown and commercial areas on the first floor. Louie’s in Ashland would be great for downtown which is a rooftop bar. I think the city has been consistently short-sighted.
Unless we provide a direct loan to afford a down payment, we will not see first time home buyers. There is revenue for the city if we can get more people. Loan the money to the people and continue to collect and roll over the loans for more people. We don’t request a large down payment to help people get into a house they typically could not afford. The city needs to take some chances and responsibly to help the young people. We must get them started and if we don’t give them something to work for then they have no pride.
I think there is an error in where the aquatic center is being located. It should be in a section where there is a larger section of low-income people and concerned about the travel route for kids from the main part of town.
I think we need to stop dumping the homeless into one barrel. There are some people who have mental health issues and I wish there should be some form of housing for the mental disorders that is higher security and assistance. These people are getting hurt and they don’t know which end is up. We need the security, so these people aren’t getting robbed and they are getting the help they need.
Participant #7
Section titled “Participant #7”-
What are the top three issues you come across when help those seeking out housing or building housing?
For building housing, a lot has to do with developable site that are appropriately zoned. We vetted a number of sites for the Siskiyou Crossroads. There were twenty sites vetted and for one reason or another were not feasible. When we are looking at multi-family housing, we have to look at a number of sources. To get those sources, it can take years to align with them. It can be difficult to get a land owner to agree to these long-term processes. Land banking is an avenue to identify and set aside properties for housing to work with the City. Part of that is doing the environmental assessment and make sure zoning is correct. We need at least 40 units to pencil out the rent and cost to construction. The revenue from rent is not enough to make the housing projects work. It is difficult to build just 10 units. Market rate may be able to accommodate the smaller amount of units because they can charge higher rent. The financial feasibility can be difficult. It would be helpful to have planning documents updated including the zoning, general plan, and permitting documents.
Humboldt is reaching out to landlords and property owners to rezone to a higher density that could be developed into low income and higher densities. During the rezoning of a property, they accommodate the environmental work for the higher density. That program is going well but the Board of Supervisors has yet to approve the financing for this project. The environmental can be difficult.
-
What should the City’s priorities be when addressing housing needs for the community?
The more rural areas need more housing for all levels o housing; workforce, medical staff, and others. It is really just having more housing in general. The City should look at the relationships with developers. There are a lot of procedures and regulations, but the City could support the housing more by having regulations in compliance with the state. Trying to problem solve with developers instead of adversarial.
-
What do you feel are the greatest challenges to finding or developing housing in the City?
The greatest challenges are finding subcontractors that have the capacity to work in that area. There are some from Oregon but not enough to make everything move forward. Lack of available contractors, remote location, and funding sources. A person at the County really championed the Siskiyou crossroads projects that made it happen. We need a champion at the City and County to run these housing programs. There are issues with capacity at cities to manage these programs. Cities have to have the capacity to run these programs. You basically need a whole department to manage these project initiatives.
-
What types of housing do you think would be most beneficial for the community? (e.g. fourplexes, apartments, townhomes, tiny home/ cottage developments, or others?)
I don’t consider myself a local person. I think we need to look at all of the various models. I think that we need to look at infill projects. If you can do fourplexes then you need a developer that can finance those. California as a whole needs all types of housing. Tiny homes are a completely different thing in and of themselves. They could serve as temporary housing.
-
Are there any developments within the City that you think are good examples of the types of housing we need?
I don’t know of anything else. Across from the Siskiyou Crossroads site there seems to be good, but the lawns could be landscaped better with native vegetation.
-
Are there certain areas in the City you think could benefit from revitalization as housing or mixed use developments?
I have the County funded study that was done for the Crossroads. They looked at the entire county so it is not Yreka specific, but there could be some other sites in Yreka. The proximity to amenities needs to be prioritized. Medical, grocery, and other essentials. We need to look at the City cores and under-utilized. Really look at the infrastructure that we already have. Can we convert any of those sites we already have services too. Yreka is in a wildfire zone that is challenging. The builder risk is high and the insurance companies are charging high rates for builders risk. The ability to lower the wildfire danger zone would be a big deal. Yreka will not see a lot of development in these outlying fire prone
-
Are there any major housing development projects in the region that we should know about or that you think are innovative examples the City could follow?
In Arcata, DANCO complete AASC development (Sorrel Place). It was an infill lot and developed three stories. Small towns don’t typically support going up in high to reach densities. They were able to build very energy efficient and transportation focused.
Looking at smaller communities instead of metropolitan areas. There is another DANCO development that has retail on the bottom and residential on top. I believe it is called Plaza Pointe. It is across from RCHC coop. It is another three-story building. If we look inward, then we have to work up in height.
-
Do you think that recent events, including Covid-19, wildfires, and climate change, have impacted the ability of people to find and keep housing in Yreka? If yes, how?
Certainly yes. When you have fires in your region like Happy Camp. Folks may need to leave and go to Yreka which impacts housing stock and those who are house-less. When those people lose their homes in a wildfire then it certainly increases the need for housing.
-
What do you think are the best ways to engage disadvantaged groups in the community?
I think one of the keys is really looking at the nonprofit sectors that are serving the folks. The front line dealing with the populations that are underserved. City support for those non-profits is so important in that work.
The City of Eureka is starting a social service arm to use funding sources to have an outreach team that is going out and trying to deal with the encampment situation and getting them housed instead of moving them around. Trying to develop capacity in the City of Eureka to have a social service focus. This is unique because this usually falls on nonprofits. This effort is to ensure that there are resources are available and good relationships with non-profits. Eureka is getting the monies to support the programs and funneling that into other organizations.
-
Are there any other matters related to housing that you would like to share?
One model that I like to look at is the community land trust model. We created a model where a non-profit owns the land and develops to create new homeownership. If we are looking to expand our owner occupied homes then it would create more affordable housing. Ground leasing land is popular in tribal reservations as well. The non-profit would ensure the home prices are affordable over time. There is one in Arcata that RCHC created and manages. The scale is a little problem but it could be an option.
Looking at alternative tools for providing housing will be important. Think creatively that isn’t market driven. If the city wants to create a stable home then community land trust could be one of those ways.
Participant #8
Section titled “Participant #8”-
What are the top three issues you come across when help those seeking out housing or building housing?
- Permitting process too complicated, time consuming, and costly
- No housing available
- People from out of area purchasing homes they arent even living in and driving costs up so locals who work and want to live in Yreka can’t afford that option
-
What should the City’s priorities be when addressing housing needs for the community?
- Bring in working people who want to stay and spend money in Yreka
- Make what is already here livable and encourage development
- Encourage more single family homes and duplexes
- Work with developers to create ‘pre-fabricated’ plans and have flat rates for those to make the process easier and affordable
- Find a way to make it easier for contractors to work with the City and to get things done
- Work with local residents, businesses, and people outside Yreka
-
What do you feel are the greatest challenges to finding or developing housing in the City?
- Vacant lots are here we just need to have them developed
- Everything is too expensive including utilities
-
What types of housing do you think would be most beneficial for the community? (e.g. fourplexes, apartments, townhomes, tiny home/ cottage developments, or others?)
- Simple single family homes or duplexes
- Mobile homes/pre-fabricated homes
- ADUs
- Energy efficient/drought resistant
-
Are there any developments within the City that you think are good examples of the types of housing we need?
- Humbug hollow
- 2-3 bedrooms with simple floor plan
- Humbug hollow
-
Are there certain areas in the City you think could benefit from revitalization as housing or mixed use developments?
- Walkability is important
- Everywhere should be mixed use, we need more flexibility
- Encourage businesses to stay open and thrive
-
Are there any major housing development projects in the region that we should know about or that you think are innovative examples the City could follow?
- Lake Shastina
- Bend, OR
- Eugene, OR
- Jacksonville, OR
-
Do you think that recent events, including Covid-19, wildfires, and climate change, have impacted the ability of people to find and keep housing in Yreka? If yes, how?
- Definitely, a bunch of people moved from outside of the area to Yreka but arent actually involved in the community
- They live here and work from home here but don’t engage with Yreka
- Insurance costs from wildfires makes it impossible to get insurance and if you manage to get insurance it’s extremely expensive
- Definitely, a bunch of people moved from outside of the area to Yreka but arent actually involved in the community
-
What do you think are the best ways to engage disadvantaged groups in the community?
- Know your audience and meet them where they are
- Collaborate with other groups in the area that have already established connections
- Mental/behavioural health
- Hospitals
- Schools
- Get rid of the homeless people
- Connect w/ schools, go to events that are already in place
- Piggyback off others instead of trying to reinvent the wheel
-
Are there any other matters related to housing that you would like to share?
-
Non compliant lots need to be addressed
- Reach out to owners and possibly assist them to encourage clean up and redevelopment
-
Less code based, more community based
-
Cost to build is more expensive than to buy so less building happening and people just taking up space that was already being used
-
Get the word out about ADU’s and new legilation to encourage home owners to develop
-
Encourage zoning to reflect small lot housing
-
Have a list available of developers/contractors/resources for the public
-
Increase vacation rentals in Yreka
-
Increase education
-
Increase affordable safe childcare opportunities for working parents
-
Participant #9
Section titled “Participant #9”- What are the top three issues you come across when help those seeking out housing or building housing?
- People would rather rent than own or can’t afford to own and are forced to rent even when mortgage vs rent is the same price
- Small businesses are being run out of business by big box stores and people are not staying in Yreka
- What should the City’s priorities be when addressing housing needs for the community?
- Create a safer environment
- No swimming pool
- Prioritize housing and the actual community instead of using grant funds for a pool no one will use and can’t be maintained
- The problem is with employment, not housing
- Business failing and working people are leaving and low income/not working people are coming to Yreka for free handouts
- Overall income for siskiyou county is too low
- Cant have nice things when you can’t afford to spend money
- City should stimulate the economy which will bring in workforce people who have money to spend in the city
- Bustling city = development opportunities
- Need development within the middle class range
- Everything is either low/no income based or too expensive
- Willow is amazing with code enforcement but we need more clean up in the city to attract better people
- What do you feel are the greatest challenges to finding or developing housing in the City?
-
I’m honestly shocked when seeing new developments/housing
-
Get rid of slumlord landlords
-
Homeless people make it hard to want to be here
- Who is being drawn to Yreka? do we want those types of people? How do/will they influence the community?
-
- What types of housing do you think would be most beneficial for the community? (e.g. fourplexes, apartments, townhomes, tiny home/ cottage developments, or others?)
- All of it, just depends on income scale and family size
- Younger folks and older folks don’t need a lot of space but large families do
- All of it, just depends on income scale and family size
- Are there any developments within the City that you think are good examples of the types of housing we need?
- no
- Are there certain areas in the City you think could benefit from revitalization as housing or mixed use developments?
- Any open fields and land should be used for development
- Are there any major housing development projects in the region that we should know about or that you think are innovative examples the City could follow?
- no
- Do you think that recent events, including Covid-19, wildfires, and climate change, have impacted the ability of people to find and keep housing in Yreka? If yes, how?
- Not really
- Increased income = better environment
- What do you think are the best ways to engage disadvantaged groups in the community?
- I don’t know, I can’t relate to them and don’t believe anyone should be given handouts
- Are there any other matters related to housing that you would like to share?
- If people don’t have skin in the game and arent held accountable, they wont change or take care of things
Participant #10
Section titled “Participant #10”-
What are the top three issues you come across when help those seeking out housing or building housing?
- Cost of labor
- Damages incurred by lower income people making it difficult to want to give rooms to them
- Homeless can be scary to interact/deal with (not safe sometimes
- A lot of people seeking housing and it is increasing each year while housing availability is not increasing
-
What should the City’s priorities be when addressing housing needs for the community?
- Provide housing/shelters/communal areas that are safe
- Housing gives opportunities for people to get back on their feet
-
What do you feel are the greatest challenges to finding or developing housing in the City?
- Cost of labor/scarcity of labor and parts
- Not many options locally for building, have to outsource to other areas
- More people are leaving the area and those coming in arent necessarily looking for work or housing or to contribute to Yreka
-
What types of housing do you think would be most beneficial for the community? (e.g. fourplexes, apartments, townhomes, tiny home/ cottage developments, or others?)
- NO SINGLE FAMILY DWELLINGS
- Need more apartment complexes, easy to manage properties and units when clustered together, less chance for damage or issues
- Example: Southern Oregon converted old motels/hotels into living units with property management and supervision
-
Are there any developments within the City that you think are good examples of the types of housing we need?
- ‘section 8’ housing for lower income
- Pre-fabricated homes easily installed and quick to get
- Would like to see more tiny homes
-
Are there certain areas in the City you think could benefit from revitalization as housing or mixed use developments?
- All single family dwelling zones should be updated to an increased density, multiple units needed
- Right off I-5 needs to be updated, all you see when exiting the highway and entering Yreka is homeless and drug use
-
Are there any major housing development projects in the region that we should know about or that you think are innovative examples the City could follow?
- Southern Oregon converting motels/hotels
-
Do you think that recent events, including Covid-19, wildfires, and climate change, have impacted the ability of people to find and keep housing in Yreka? If yes, how?
- Yes, Happy Camp fire displaced many people and everyone came to Yreka but there’s not enough housing units for everyone
- Covid-19 provided homeless with vouchers for places to stay which crowded up any available units
-
What do you think are the best ways to engage disadvantaged groups in the community?
- Go out in person and talk to people one on one at their place of dwelling
-
Are there any other matters related to housing that you would like to share?
- City of Yreka needs to be flexible and decrease waiting times which would encourage development and developers seeking to work in Yreka
Participant #11
Section titled “Participant #11”-
What are the top three issues you come across when help those seeking out housing or building housing?
- Arduous process
- Nothing is streamlined
- Middle class is struggling
- Affordability
-
What should the City’s priorities be when addressing housing needs for the community?
- Incentivize development
- Bring in developers from outside area
- Add subdivisions
- Increase taxable income
- Decrease waiting time for permits
- Streamline process for permits
- Establish relationships between city and applicants/developers
- Create trust and transparency with the community
- Internal audit at City Hall on customer service and identify problem areas
- Incentivize development
-
What do you feel are the greatest challenges to finding or developing housing in the City?
- Lack of housing
- Increased low income population and housing over the last 20 years
- Little is done on and for nice homes and they don’t stay nice
- Attracting assets to community
-
What types of housing do you think would be most beneficial for the community? (e.g. fourplexes, apartments, townhomes, tiny home/ cottage developments, or others?)
- Single family homes in mid price range
- Small (2-4) multi units
- NO STACKING UNITS
-
Are there any developments within the City that you think are good examples of the types of housing we need?
- No but
- What is the city’s vision for what Yreka should look like and who are we trying to attract because that will determine what the city should strive in appearance
- No but
-
Are there certain areas in the City you think could benefit from revitalization as housing or mixed use developments?
- Push high density along with mixed use
- Best of both worlds: rural but close to services as county seat
- Westside Road/Walmart area should be turned into housing
- Close to many commercial businesses and resources
- Parks need to be maintained better
- Nicer neighborhoods, nicer homes, nicer people
- Focus on safety
- Push high density along with mixed use
-
Are there any major housing development projects in the region that we should know about or that you think are innovative examples the City could follow?
- No
-
Do you think that recent events, including Covid-19, wildfires, and climate change, have impacted the ability of people to find and keep housing in Yreka? If yes, how?
- Brought to light that people prefer rural areas over the city
- A lot of people relocated to Yreka while still on their ‘big city’ budget and income
- Brought to light that people prefer rural areas over the city
-
What do you think are the best ways to engage disadvantaged groups in the community?
- Look to further establish relationships with high traffic businesses
- Partner with local agencies that already have that established relationship or trust with the community
-
Are there any other matters related to housing that you would like to share?
- Central Yreka aesthetic is awful, no one would want to stop off the highway to see that and does not make people want to visit
- People need to be held accountable and plans need to be in place and upheld
Participant #12
Section titled “Participant #12”-
What are the top three issues you come across when helping those seeking out housing or building housing?
Working with people seeking housing, the issue is the lack of housing. In providing case management services for youth and unhoused is that there is referral. What people need is a place to sleep. It has been most poignant for 18 to 25 years old and there are no rentals for them. Also, there are issues with unhoused for teens that are more limited because they cannot rent.
-
What should the City’s priorities be when addressing housing needs for the community?
Encouraging building for affordable housing and requiring the new developments are affordable. We are seeing San Francisco doing a vacancy tax for funding for housing. There is so much commercial space and dire lack of housing, I would like to see the city take a stand on the vacant commercial to house unhoused youth and families. Policies that encourage construction that would bring in developers that would build affordable housing.
-
What do you feel are the greatest challenges to finding or developing housing in the City?
The lack of available housing. Not enough apartments. There are not enough bedrooms for people to sleep. When we are able to connect folks with rentals then price is the next biggest issues. Pets is the final issue. Many people have pets and the rentals do not accept animals.
-
What types of housing do you think would be most beneficial for the community? (e.g. fourplexes, apartments, townhomes, tiny home/ cottage developments, or others?)
I would really like to see more apartments for affordability. I think there is a huge need for single family homes and folks are looking into the ‘American dream’ but as far as affordability that is out of reach for our families. Apartments are more affordable. The variety of apartments including studies, 1-bedroom, etc. Personal experience with difficulty finding 1-bedroom apartment. Young adults are the focus and that is the lens.
-
Are there any developments within the City that you think are good examples of the types of housing we need?
The Siskiyou Crossroads Project is a perfect example. Coming from social services, we really need the integration of social services and housing. Especially dealing with unhoused with substance abuse and mental health issues. The supportive services are essential for the long-term success.
-
Are there certain areas in the City you think could benefit from revitalization as housing or mixed use developments?
The area around Fourth Street is mixed use but the housing could use some revitalization. Having stricter policies in place for private landlords would significantly improve the quantity and quality of the rentals. The area of Fourth Street has many housing units that are in disrepair. There are residential uses that were converted into the commercial, I would like to see this stop and reversed.
-
Are there any major housing development projects in the region that we should know about or that you think are innovative examples the City could follow?
Youth focus. Safe Place for Youth in LA have a full spectrum of housing for minors and transitioning youth. Emergency shelter, transitional housing, apartments that they manage as landlords. Funded through a series of government, non-profit, and private funding. It is important to have a variety of housing types to deal with their specific needs.
-
Do you think that recent events, including Covid-19, wildfires, and climate change, have impacted the ability of people to find and keep housing in Yreka? If yes, how?
Absolutely. COVID, we saw an influx of folks form Siskiyou County because they could keep their jobs form SF and live remotely. Most younger people could get loans during this time but still couldn’t get housing because people with greater disposable income get homes for cash offers over financing. Wildfire is a yes. The point in time count resulted in at least three different people who lost a home in the Slater Fire and came out because Yreka had resources to help them. The Happy Camp relocation resulted in people staying in Yreka. There are 12 people families staying in a small single family home.
-
What do you think are the best ways to engage disadvantaged groups in the community?
Offer food during outreach and engagement events. If there isn’t food, then people are not showing up. Offering a dinner and childcare is a big need. With the youth population, it is difficult for groups to provide input. Personal relationship building and partnering with the various people focused organizations that already have the connections. Youth advisory group is already together and the city can go to them instead of creating another event to participate in. Stipends for contribution. Even something as simple as $50
-
Are there any other matters related to housing that you would like to share?
The last time that I was a renter personally was in the bay area and I have become a renter again. It was terrifying to do that in Yreka. There is no protection from private landlords that is provided by a housing board. It is hard because we don’t want to discourage people from becoming landlords but there are some very poor rentals in Yreka.
I would love to see the City to build out the capacity to meet these issues head on. PLHA and other funding mechanisms are going to increase. It would be great to see the City to build out capacity to be able to apply and give out the monies available. Capacity looks like more staff time to apply, manage, and follow up with funding resources. A concentrate interest in doing these types of projects and programs. There is more energy with new staff and would like to see the housing interest continue. The city needs to leverage their relationship with the County for them to take more action. Coming out and saying we are going to house everyone in Yreka and focus on that. Not being afraid to state that we want more housing and dealing with criticism.
Participant #13
Section titled “Participant #13”- What are the top three issues you come across when help those seeking out housing or building housing?
- MS4 requirements throws people off and has extra costs that most people don’t anticipate
- Property lines in Yreka are terrible and make conducting surveys and plotting out site plans a nightmare
- Homeless people are a deterrant to those wanting to relocate
- Cost of living/cost of building and development
- What should the City’s priorities be when addressing housing needs for the community?
- Increase single family dwellings; no one moves to Siskiyou County for apartments
- Apartments deteriorate faster than SFD and require more upkeep
- Increased people moving to Yreka increases the demand for housing
- Average age of house in Yreka is old (45 years) and most people with money (those we should be attracting) want newed updated houses
- Need an increase in workforce housing
- What do you feel are the greatest challenges to finding or developing housing in the City?
- Cost of living and building is too high
- School taxes are too high
- Solar and fire/sprinkler requirements cost too high
- Need to bring in developers to Yreka
- What types of housing do you think would be most beneficial for the community? (e.g. fourplexes, apartments, townhomes, tiny home/ cottage developments, or others?)
- All types of homes/places to live
- Older people move to Yreka for space and SFD, young people without families would live in apartments though
- Are there any developments within the City that you think are good examples of the types of housing we need?
- Incorporate roundabouts
- Maryhill Circle
- Are there certain areas in the City you think could benefit from revitalization as housing or mixed use developments?
- Space and land is available, it just needs to be developed
- Provide hard numbers/flat rates to developers
- Keep Main Street Commercial and separate away from Residential zones
- Are there any major housing development projects in the region that we should know about or that you think are innovative examples the City could follow?
- Look at Medford or Bend, OR
- Do you think that recent events, including Covid-19, wildfires, and climate change, have impacted the ability of people to find and keep housing in Yreka? If yes, how?
- Doubled prices of homes and limited availability
- More people relocating to Yreka
- What do you think are the best ways to engage disadvantaged groups in the community?
- Take the time to build trust
- Keep it rural
- Are there any other matters related to housing that you would like to share?
- Bring in new business to attract new people
- Maintain what we already have (Greenhorn Park)
Participant #14
Section titled “Participant #14”-
What are the top three issues you come across when help those seeking out housing or building housing?
Because we handle, 105 rental properties which are mainly single family homes. Immediate hurdles are things like rental history, what is the rental history, income base, are they smokers, cannabis smokers are difficult to deal with. We have individual properties owners who are not subject to the TPA. A form that we have to fill out for just cause eviction. We have only 6 properties that allow outdoor smoking. Probably 8 properties are commercial. We cannot rent to smokers and we do not advertise in advance that we are smoke free. Any disclosure of smoking disqualifies people immediately. Another thing is the need for ground level housing for people with physical difficulties. This can be the aging and those who are injured. A lot of properties have stairs. The ground floor units are preferred. The price of housing. As housing increases for sale, the cost of rentals are going up. Insurance is also going up which impacts rentals. Replacing roofs and hot water heaters is difficult due to no trades trained people and supply chain. It is difficult to get things done in a timely manner and cost-effective way. We only hire people who are licensed and insured. This makes it difficult to get people to fix up houses. We do operate a client trust account. We charge 10% for clients that we handle for multiple units. We are also looking at adjusting account to a treasury account to accept ACH payments. That is not a cheap process. We predominately have owners that are fine with month-to-month rentals. That is a key element that gives access to a pool of applicant that are not otherwise available to us. The medical community, highway patrol, and forest service often fill units for temporary housing while they look for a permanent home. It is huge to offer the transition housing option for those people. As far developing, I was contacted for some lots on Sierra Vista and miner, some of those are R3-12 and R3-16 zoning. In short order, I am not sure that this is the only issue. The feasibility to make large scale development happen is difficult. I don’t know the whole scope. When people ask me what the rental rate is then I give a conservative estimate. Building a house is about $250 a sq ft for a basic house. We go through the education of the land and developing.
-
What should the City’s priorities be when addressing housing needs for the community?
It reflects back on me that I should be participating more in the city activity. My company is young so I have been focusing on building my business. Low income housing really needs to be something that needs to be addressed. The previous low-income properties in the Campbell area that has increased to low to mid $200,000 range. Where are people supposed to go that are working class and just starting to afford homes. I am interested to see more low-income assistance. I don’t what incentives the City offers and this is my lack of knowledge. As far as individuals and companies coming in to build multi-plex properties that have accessibility we need incentives. I hear complaints about the building code. It seems difficult and expensive for the infrastructure for housing. I appreciate clean drinking water and sewer and I understand that part too so I don’t have a recommendation.
-
What do you feel are the greatest challenges to finding or developing housing in the City?
Above. Part of it is California for the building code. Sprinklers in the attic where we have freezing temperatures isn’t helpful. I don’t know where in the city is able to be built, unless we expand the City limits. I hear people talking about the building codes and the expense at getting started.
-
What types of housing do you think would be most beneficial for the community? (e.g. fourplexes, apartments, townhomes, tiny home/ cottage developments, or others?)
If I had to rank them: duplex, triplex, tiny home development. Tiny home developments are cost effectiveness and people are looking to downsize and simplify their lives. Dealing with estate sales and clients to sell homes with so much stuff. We have too much stuff which is a whole other thing. Big fan of the tiny home development. There are so many people at least on the surface are interested. I don’t know if they are able to do it for the long haul.
We need more veteran housing. The is a special sector but needed. Multiplex housing for veterans would be nice. 4-bedroom low income families.
-
Are there any developments within the City that you think are good examples of the types of housing we need?
Oakridge: I like the way it is located. It is on a hillside which may be an issue for those who walk for services. In the winter it is slippery. It is a little farther away from the services but nice.
I like Crystal Glen mobile home park off Deer Creek. I am not opposed to multiple unit apartments on Miner Street. I think that it is unsafe now and I have had clients that wanted to move quickly after moving there. It is well maintained and did not hear anything too bad when I lived nearby. I like the Campbell Avenue subdivision. The new subdivision is great and would like to see that expanded at the end of Discovery Street. If you were to put low-income housing that way would use that subdivision as a traffic route may upset.
-
Are there certain areas in the City you think could benefit from revitalization as housing or mixed use developments?
I would like to see something done with the Shop Smart. It was expensive and a triple net lease which make it difficult to purchase or lease. The area around it too could be improved. The area underneath the freeway by Oberlin could be better developed. I really like what is happening off of Foothill like the Siskiyou Crossroads. Sierra Vista is a good area for condos and could increase the units and services. It would be nice to see something similar expanded in that area with the views. The HOA fee is not terrible and there is a mixture of units. It is terrible for accessibility though. What could be developed as the city changes the city limits to include more of Oberlin and Phillipe. There are property owners that I have represented in the past that would be interested in annexing to the City.
-
Are there any major housing development projects in the region that we should know about or that you think are innovative examples the City could follow?
I like the idea of commercial on the first floor and housing on the upper floors for the downtown. I think it would be great to convert the Franco-American building. I don’t know what the feasibility is but that would be a cool building.
-
Do you think that recent events, including Covid-19, wildfires, and climate change, have impacted the ability of people to find and keep housing in Yreka? If yes, how?
I think it has. Specifically, the properties that we manage were affected less. We communicated a lot with our folks. If they did not pay, then we provided the information for them to qualify for the various programs. We did not go into the place with people not paying for a year. We worked with people waiving late fees. We had a lot of families from Happy Camp and the Paradise Fire that moved here and someone who left for Phoenix then came back due to fire. Insurance was helping pay the rents up to $1600 for a 1-bedroom rental which is a lot and possibly tipping the market for rentals. The influx of people from fire zones and we haven’t been building like we used to. The population has been expanding and there are no new homes. Yreka is being found as an area for inexpensive housing so people from the Bay area who purchase now who are looking to retire who could not afford in the Bay Area. The upturn of the market during the pandemic, people realized during COVID19 that they can move to other areas but not out of state. People are coming here for that type of thing. The airport in Medford is close enough for those people.
We need to be better at high-speed internet in the county. The city is good about high speed internet. Scott Valley is going to see an increase in interest with the inclusion of fiber internet. I don’t think Prop 13 has influenced my line of work.
-
What do you think are the best ways to engage disadvantaged groups in the community?
It is a complex question because I am not aware of all the ways you are already engaging these people. As an aside, I am happy to see code enforcement officer who are visibly and engaging the portion of our population that are unhoused. There is a massive mental health issue. It is certainly not just Yreka or California. There needs to be state and county assistance for people with chronic mental health issues that need 24-hour care. People benefit from these programs for end of life or lifelong assistance. I wonder if there could be a group that could be pulled together form faith-based organizations and folks that could help with services and ideas. I would like to see more direct help for the homeless.
-
Are there any other matters related to housing that you would like to share?
As someone who is looking to improve a property and the ongoing projects, it is also true that when people come through Siskiyou County and looking for areas where they want to live. There is less of a homeless population in Scott Valley which is a big draw for some people. I have sympathy for the homeless and the help that they need, and I also see the concern of property owners and families that just want security and safety in their community. I feel Yreka looks like it needs help with the people on the street. We need to help the construction of a shelter like Hope House. It feels like such a massive undertaking, and I feel like there isn’t one magic answer. I think there needs to be a multipronged approach.
Footnotes
Section titled “Footnotes”-
Examples of fair housing resources include overview information and definition of fair housing, examples of discriminatory practices, summary of state and federal fair housing laws, and fair housing service agencies available in Yreka, Siskiyou County, and the north state region. ↩
-
Cost To Build 2022. Home Construction Cost for 1,500 sq ft single family home with 2-car garage. Access March 16, 2022, from https://www.costtobuild.net/estimator.html. ↩
-
https://www2.census.gov/programs-surveys/acs/tech_docs/subject_definitions/2021_ACSSubjectDefinitions.pdf, accessed May 23, 2023. ↩
-
Ibid. ↩
-
The total Yreka population of 7,559 listed in Table A-16 differs from the value of 7,807 listed in Table A-1 of 7,807 relates to the methodology used to estimate this subpopulations. ↩
-
No maximum density listed in the Land Use Element. Reported maximum density based on Table 1-4 (General Plan Designation & Zone Consistency) of the Land Use Element of the General Plan, which identifies R-1 and R-2 as possible residential zoning districts in the HD. ↩
-
20% is for residential uses, maximum lot coverage for nonresidential uses is 60%. ↩
-
Parcels zoned R-3-12, the maximum allowable density is 12 dwelling units per acre. ↩
-
Willson, Richard. (2013). Parking Reform Made Easy. Island Press. ↩
-
Fair Market Rent is determined by HUD for different jurisdictions/areas across the United States on an annual basis. ↩
-
2022 Median Family Income (MFI) limits based on 2022 Income Limits from HUD. In Siskiyou County, the median family income in 2022 was calculated to be $62,700. The income limit for a very low-income household was $27,300 for a one-person household, $31,200 for a two-person household, and $35,100 for a three-person household. ↩
-
Affordable cost = 30 percent of household monthly income minus estimated utility allowance of $100 for a one-bedroom unit, $150 for a two-bedroom unit, and $200 for a three-bedroom unit. ↩
-
Cost per unit is based on the estimated cost of the Crossroads project currently underway in Yreka. This development will consist of 50 units and is estimated to cost $26 million to construct. ↩
-
National Center for Education Statistics, https://nces.ed.gov/, accessed December 30, 2022. ↩ ↩2
-
Tribal Government Profile and Summary, https://www.karuk.us/images/docs/hr-files/Karuk-Tribal_Government_Fact_Sheet_2020.final.pdf, Karuk Tribe, accessed December 30, 2022. ↩ ↩2 ↩3
-
Karuk Tribe Service Area Map, https://www.karuk.us/images/docs/Land_Management/Service_Area_with_Base_Map.pdf, accessed December 30, 2022. ↩
-
Affordable Housing Tax Credit Coalition, https://www.taxcreditcoalition.org/gallery/karuk-homes-1/, accessed January 5, 2023. ↩
-
The Diversity Index indicates the probability that two people chosen at random will be from different race and ethnic groups. For more information about the index and measuring racial and ethnic diversity, see the US Census blog, https://www.census.gov/newsroom/blogs/random-samplings/2021/08/measuring-racial-ethnic-diversity-2020-census.html (accessed June 14, 2022). ↩
-
In 2019, the poverty line was $25,750 for a family of four, according to the U.S. Department of Health and Human Services: 2019 Poverty Guidelines | ASPE (hhs.gov), accessed June, 21, 2022. ↩
-
While the retail density differential between the western and easter tracts is significant with the western tract having 3.3 jobs per acre, and the 0.87 jobs per acre for the eastern tract, this may be more of a function of the difference in the size between the two areas. The mapping indicates the eastern tract is at least twice the size of the western tract. ↩